When I set out to make my county-by-county map of the 2020 “election,” color coding each of the 3,144 county equivalents red, yellow, or green based on observed deviation from established trends (registration, population, and voter behavior), I ran into a guy named Shane Skinner, from New Hampshire. Shane is a mapping wizard and took the initiative to keep a running map that he would update every time I released my findings on a new state.
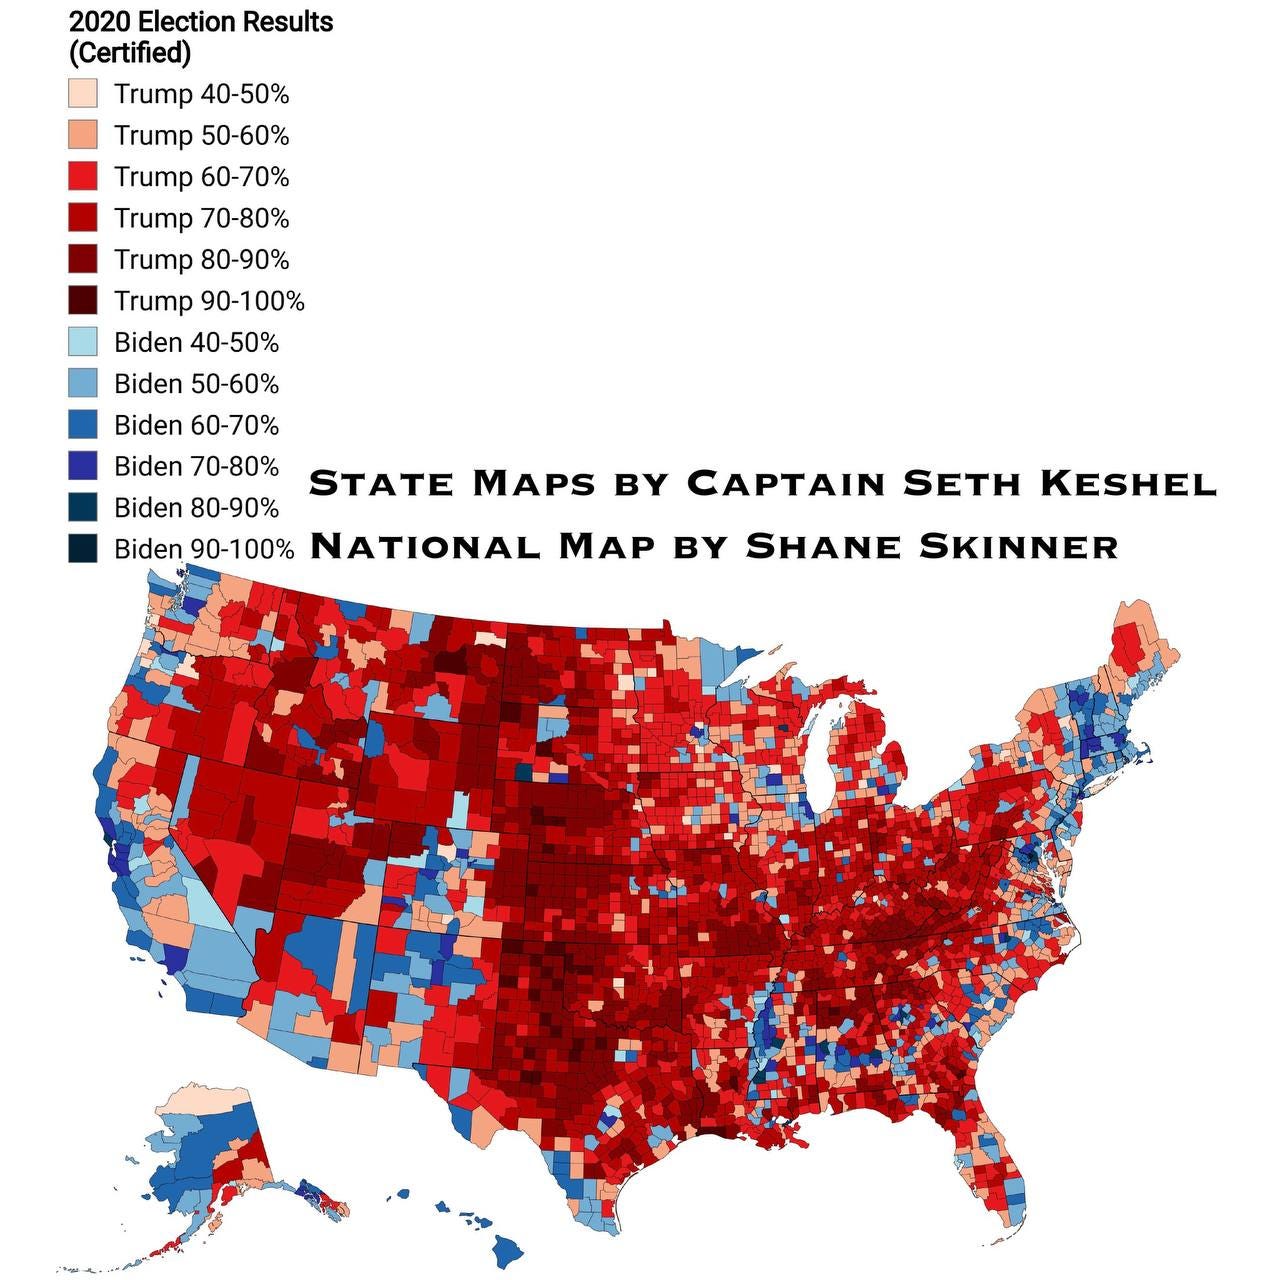
I reached out to him this week to ask for two new maps, one with the certified results of the 2020 election by county, shaded to show strength of victory by the intensity of the red or blue occupying the shape of the county. The second map would adjust for likely shade based on the counties I have identified as disparate. According to the certified results, Donald Trump carried 2,589 county equivalents in 2020, down from 2,626 in 2016. Here are the certified results denoted by percentage of vote received by the winner of each county.
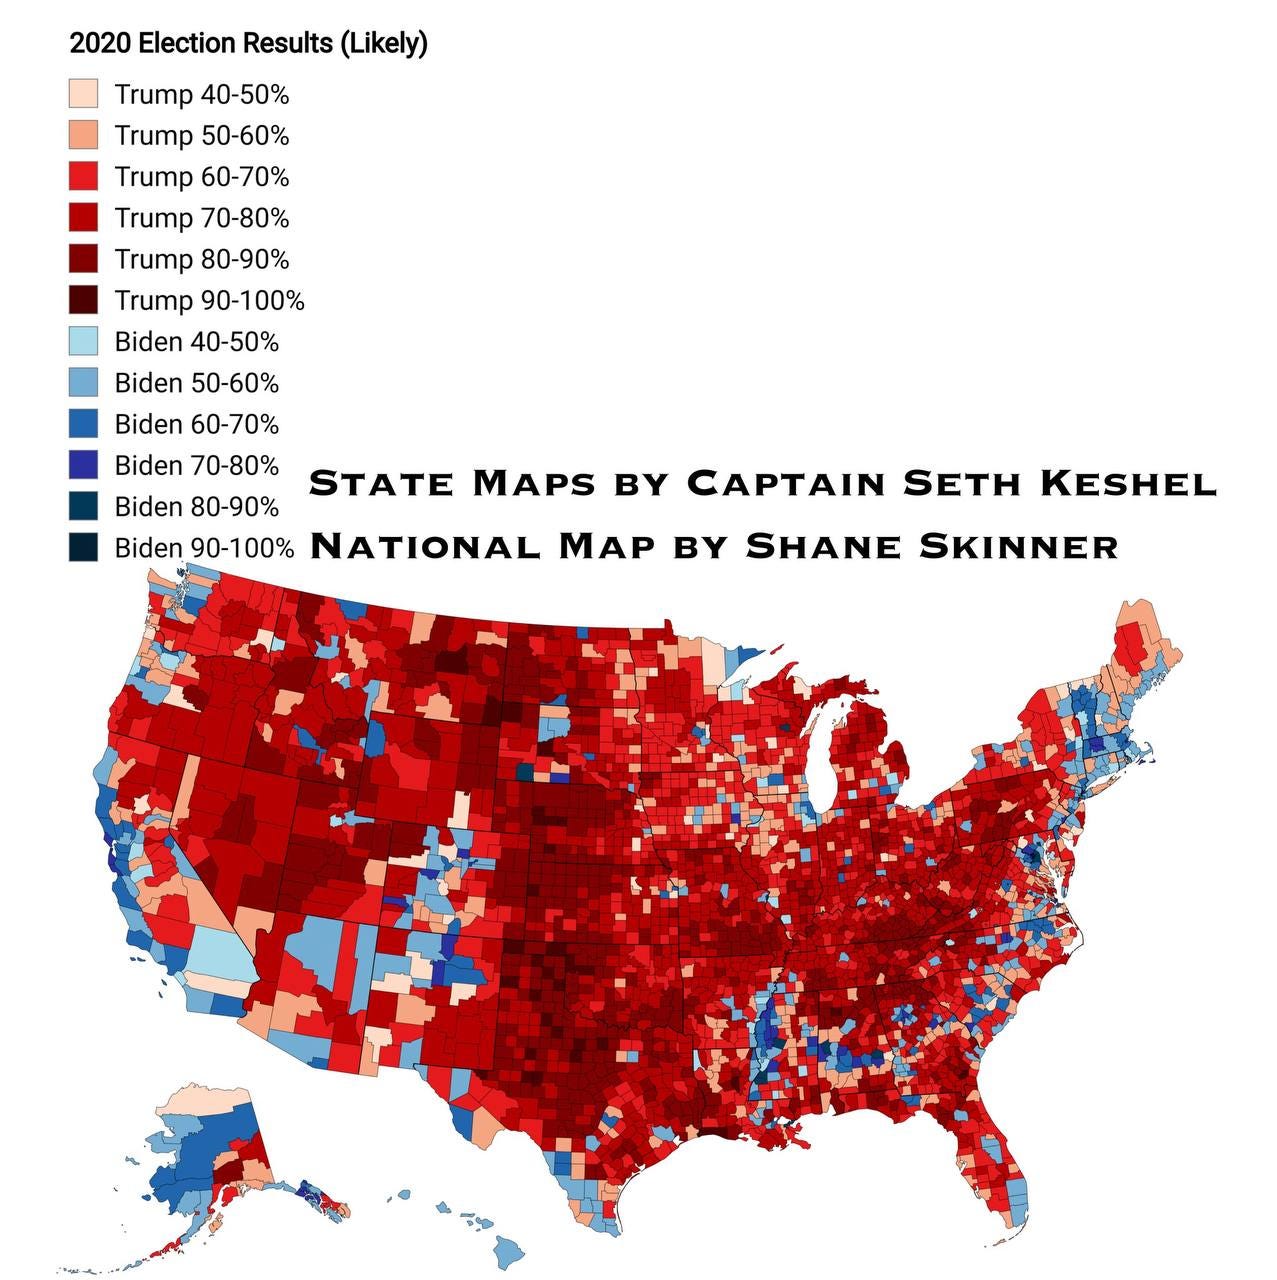
Of course, soft shades of red in key states like Georgia, Michigan, Pennsylvania, and Wisconsin, combined with bright blue shades in the urban strongholds of those states, decided the election in favor of the non-campaigning, senile political retread. Based on the likely county vote shares, with the counties identified last summer, Shane and I created the map of the likely results below:
These results, based on two decades of trend analysis that factors in population change, registration information, and voter behavior, suggest Trump should have carried 2,702 county equivalents, and the red counties throughout the key swing states and other curious battlegrounds with much more intensity. Biden’s margins in almost all the key urban strongholds are overly inflated.
Among counties that should have been won by Trump (and as always, these are slam dunks based on my lenient estimating), these are the most surprising and critical.
Alaska
Anchorage
Arizona
Maricopa
California
Fresno
Riverside
Colorado
Pueblo
Florida
Duval
Hillsborough
Pinellas
Seminole
Illinois
DeKalb
Peoria
Kansas
Johnson
Maryland
Frederick
Michigan
Genesee
Kent
Muskegon
Minnesota
Olmsted
St. Louis
Nebraska
Lancaster
Nevada
Clark
Washoe
New Hampshire
Hillsborough
Rockingham
New Jersey
Atlantic
North Carolina
New Hanover
Ohio
Montgomery
Pennsylvania
Bucks
Dauphin
Erie
Lackawanna
Texas
Fort Bend
Hays
Tarrant
Williamson
Virginia
Chesterfield
Stafford
Virginia Beach
Washington
Clallam
Clark
Pierce
Skagit
Wisconsin
Door
Rock
Furthermore, 142 counties had to be moved up to reflect 70-79.9% of the vote in favor of Trump, and another 67 up to reflect 80-89.9% in favor of Trump. These artificially shortened margins were instrumental in ripping off the electoral votes of key red states and are also evident in states like Florida, Texas, and North Carolina, where Trump still managed to hold on. Biden had one downgrade from 90-100%, nine from 80-90%, 17 from 70-80%, 39 from 60-70%, and 35 away from 50-60% (many of which flipped to Trump).
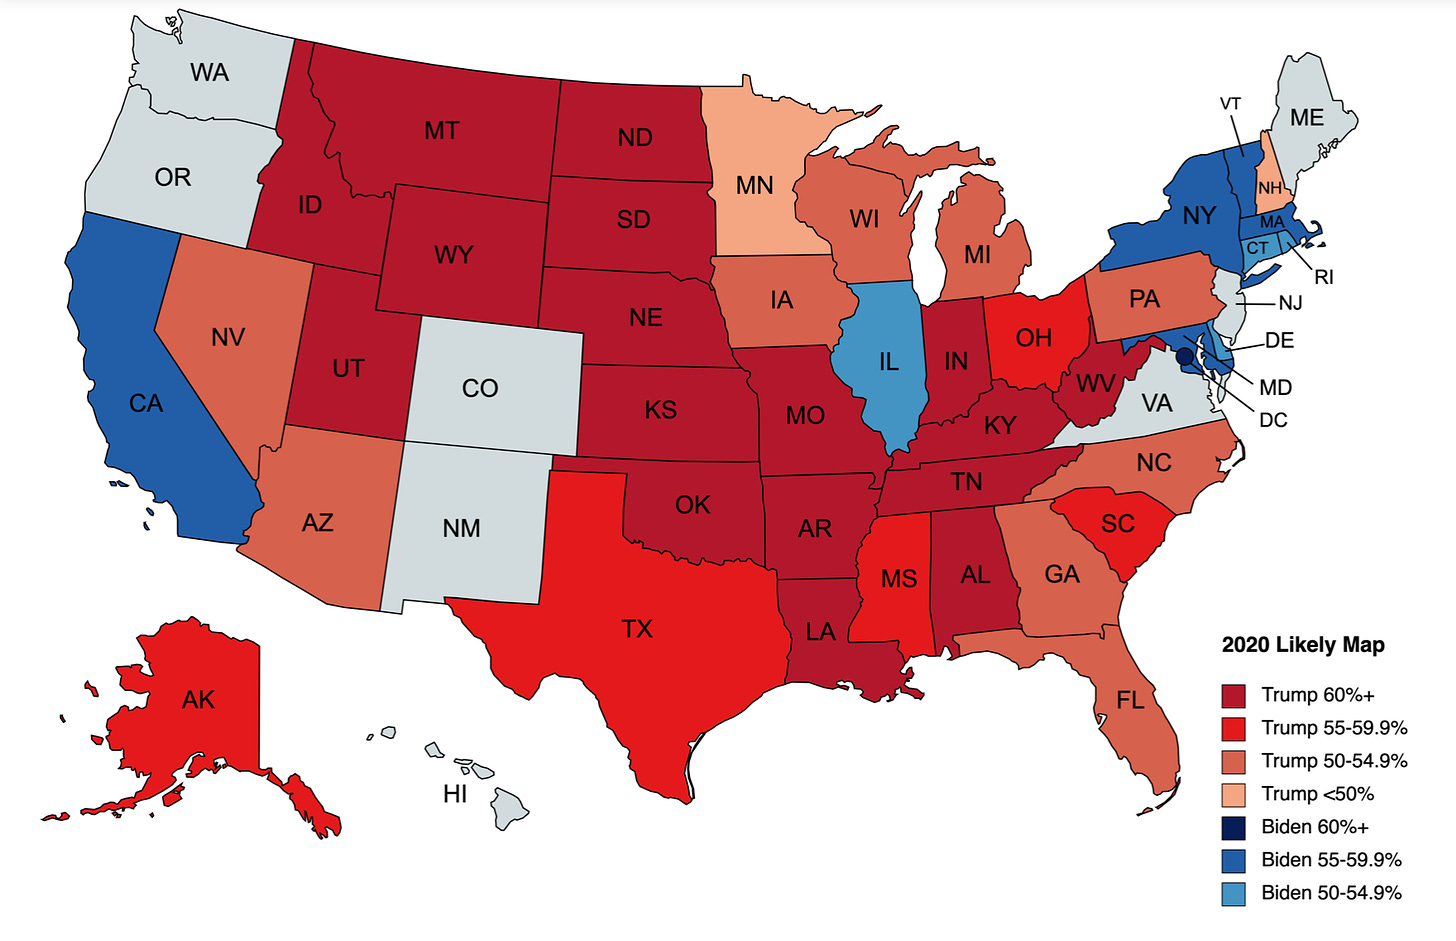
With all of this considered, what does the electoral college map look like? Here is the most conservative estimate I can come up with below.
Trump has a bare bones minimum of 326 electoral votes, which is precisely what I predicted on November 2, 2020, including the 2nd Congressional District of Nebraska and the first Republican win of Minnesota since 1972. The states up for grabs appear to be Washington, Oregon, Colorado, New Mexico, Virginia, New Jersey, Maine (at large), and Hawaii. Yes, that Hawaii. All four counties are listed in the 50-59.9% blue category in the likely map above, but my estimates are lenient and do not take as much liberty in making assessments as the map above.
The states not assigned have sizable working-class populations and elections characterized of late by push-pull trends (one party gains at the expense of the other). Trump’s gains in those states are magnificent, and in many of those states, like New Mexico and Colorado, driven by gains in the once-Democrat minority working class. In Oregon and Washington, there has been a sizeable working-class shift in the fishing and timber industries to Trump beginning in 2016, when Grays Harbor County, Washington, and Columbia County, Oregon, flipped red for the first time since 1928.
There you have it. Trump, in a clean 2020 election, was likely to have carried 2,702 county equivalents, a minimum of 326 electoral votes, and perhaps as many as 390. It is critical to understand the basic forecasting principles behind our elections, so you don’t fall victim to biased, fake media polling.
SK


I am Shane Skinner. I am honored to have received such praise from America’s Captain.
I thank you for your service Mr. Keshel!