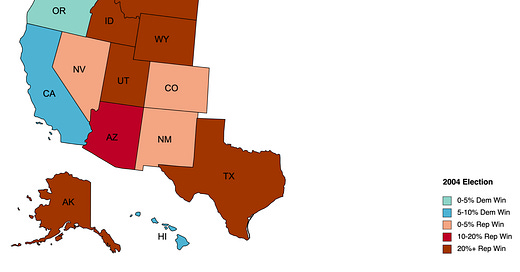
How Does California Double Its Own Democrat Votes and Also Turn the West Blue in Just 20 Years?
Topic: Elections
As I travel, I like to take note of signs and indicators that portray the true political disposition of a given area. Although California’s elections are dominated by the coastal counties ranging from San Diego in the far south to those making up the Bay Area in the north, I have travelled hundreds of miles of highways in the past three days between Redding and Fresno. I have not seen a single sticker, sign, or billboard in support of the leftist policies that have destroyed California’s overall prosperity.
Anecdotes are not everything, but they are something. Central and Northern California, a year and a half post-Trump, are still flush with MAGA gear, symbols, and swag. I am often asked specifically if I think Trump carried California in 2020, alongside Georgia and the obviously stolen states in the Midwest and Southwest.
My answer is “no,” but that is only considering the methodology of my forecasting technique within its limitations. My technique highlights disparities in open-source data like overall voter registration, voter registration by party, population change, and voter behavior (coalition shifts) and is particularly useful for spotting the disparities for the 2020 election, and allowing me to come up with an estimate for excess votes based on a two decade cycle.
Here is the truth about California:
Keep reading with a 7-day free trial
Subscribe to Captain K's Corner to keep reading this post and get 7 days of free access to the full post archives.


