Introduction to 2024 Election Analysis and the Hunt for Election "Fortification"
Topic: 2024 Election Analysis
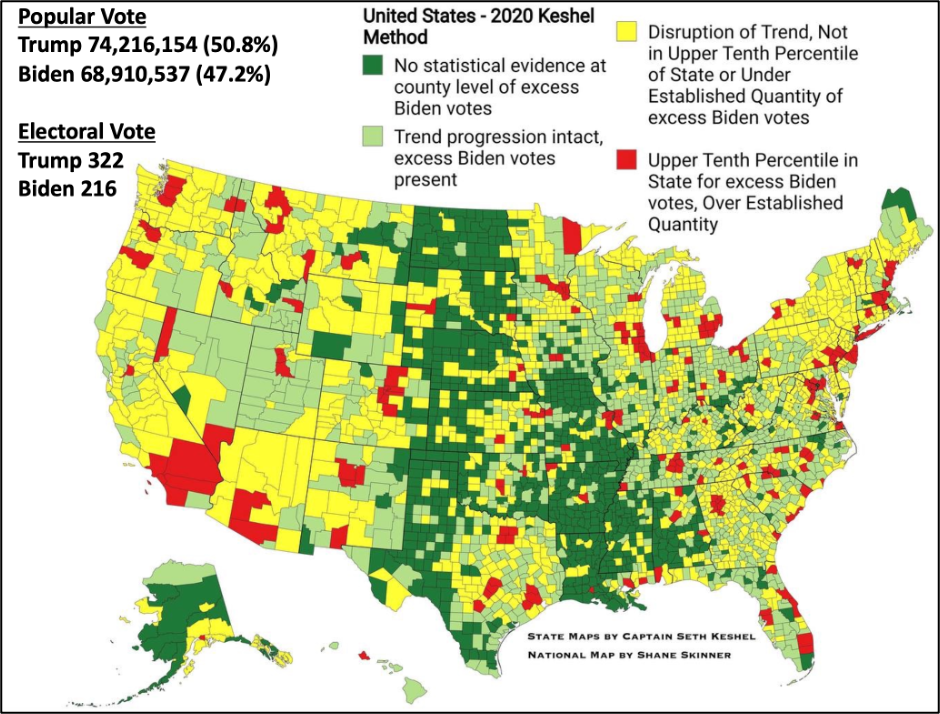
Those who have followed my work since 2021 will most certainly remember my hallmark map of the 2020 quasi-election, shown in its second edition below:
The counties marked in red were the most notable and featured the largest gains in new Democrat ballots added since 2016, with counties in yellow deemed suspect in that they ran against established trends and, where applicable, the known voter registration shift. Dark and light green (in most cases) counties were of the least concern.
That assessment, that Joe Biden likely had more than 12 million bogus ballots brought about by wholesale defiance of election law and last-minute changes and rulings against existing procedure, brought me a lot of heat and earned me a spot on the Mount Rushmore of so-called election denialism.
I am in the production phase of analyzing the 2024 election data, which, thanks to several inept and corrupt states, still hasn’t finalized yet. This assessment will be much harder for regime water carriers to criticize since it involves far less proprietary analysis from me and simply analyzes the changes in Democrat ballot counts in all three of Donald Trump’s campaigns for President (2016, 2020, and 2024). My plan is to issue analysis by region for the less impactful states (for example, a Southeastern analysis for Mississippi, Louisiana, Alabama, and Tennessee), and by state for the more significant states and/or battleground states.
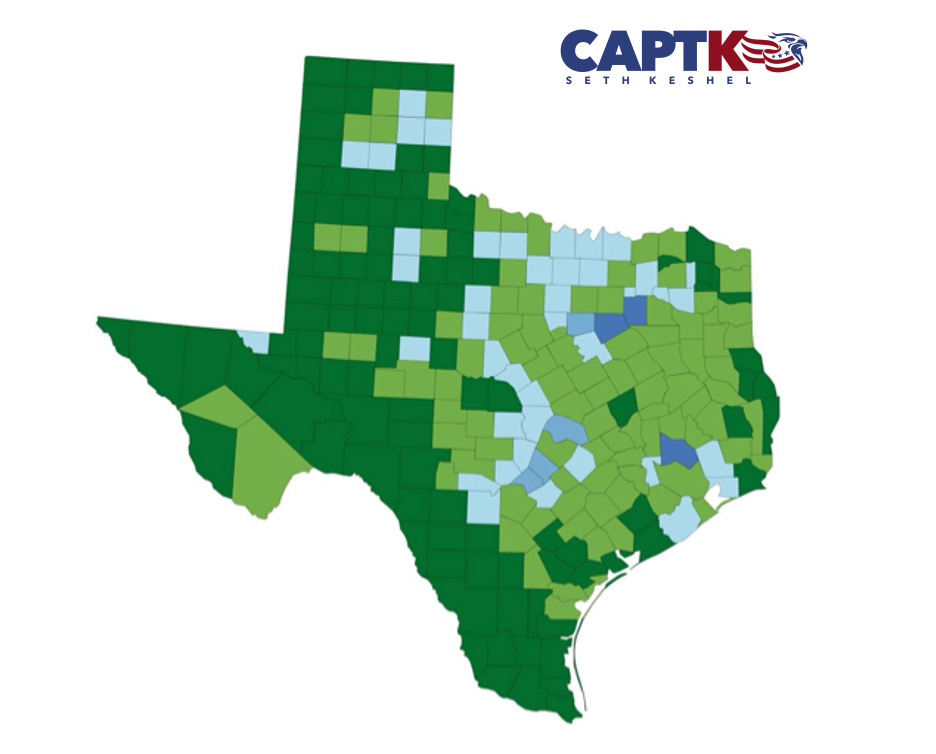
This is how my hallmark 2024 analysis will roll out in a map I will refer to as the Three-Cycle Election Contrast Map:
The example of Texas above displays five simple shades that help me know where to dig, and none of it directly implies or infers election manipulation, which may be deduced by a more granular analysis. As this map stands, the media could print it and no one could suggest I had any motive but to highlight the changes in Democrat presidential ballot count since 2016.
· Dark Green – Harris had fewer ballots than Hillary Clinton in 2016
· Light Green – Harris had fewer ballots than Joe Biden in 2020, but more than Hillary Clinton in 2016
· Lightest Blue – Harris gained between 1 and 1,999 ballots over Joe Biden’s 2020 ballot count
· Middle Blue - Harris gained between 2,000 and 5,999 ballots over Joe Biden’s 2020 ballot count
· Darkest Blue – Harris gained over 6,000 ballots from Joe Biden’s 2020 ballot count, and the gain represented a jump of at least 10%
When state maps are joined together, the picture is much more telling and points me to where likely election fraud networks would have operated from and which areas they were most likely to impact. Please note that my example of Texas does not constitute secondary analysis, nor does it suggest election fraud.
Please consider subscribing to this journal as a paying member as I roll out in-depth 2024 Election analysis that will be crucial for toppling election corruption in the Trump 47 administration.
Seth Keshel, MBA, is a former Army Captain of Military Intelligence and Afghanistan veteran. His analytical method of election forecasting and analytics is known worldwide, and he has been commended by President Donald J. Trump for his work in the field.


Those on that Mount Rushmore of election denialists will save our country one day.
With Clinton, Obama and Harris all credited with vote totals in the 60’s of millions. It’s absurdly naive not to be suspicious that Biden in 2020, already showing signs of dementia and “campaigning” from his basement, collected 81 million votes.
It is equally absurd and naive to presume that because Trump-Vance earned 312 electoral votes from 31 states, the cheating stopped. Instead, some of the down ballot counting is significantly suspect.
I look forward to your analyses as soon as they become available.
Thanks for your attention to this vital issue.