I have received one question consistently about the Precinct Mapping Project – how do you arrive at estimates for fraud in each precinct? This piece gives you a glimpse under the hood and uses York County, Pennsylvania, as an exemplar.
Steps
1) Examine Population Growth
In the 2010s, growth of 21,456 per U.S. Census, or 4.9%. That is modest growth and not enough to throw the trajectory of a county’s presidential elections from previous decades. I would expect more votes cast in 2020 than in 2016. This is the lowest population growth in the county over a decade since the 1980s.
2) Examine Trend and Party Registration (if Available)
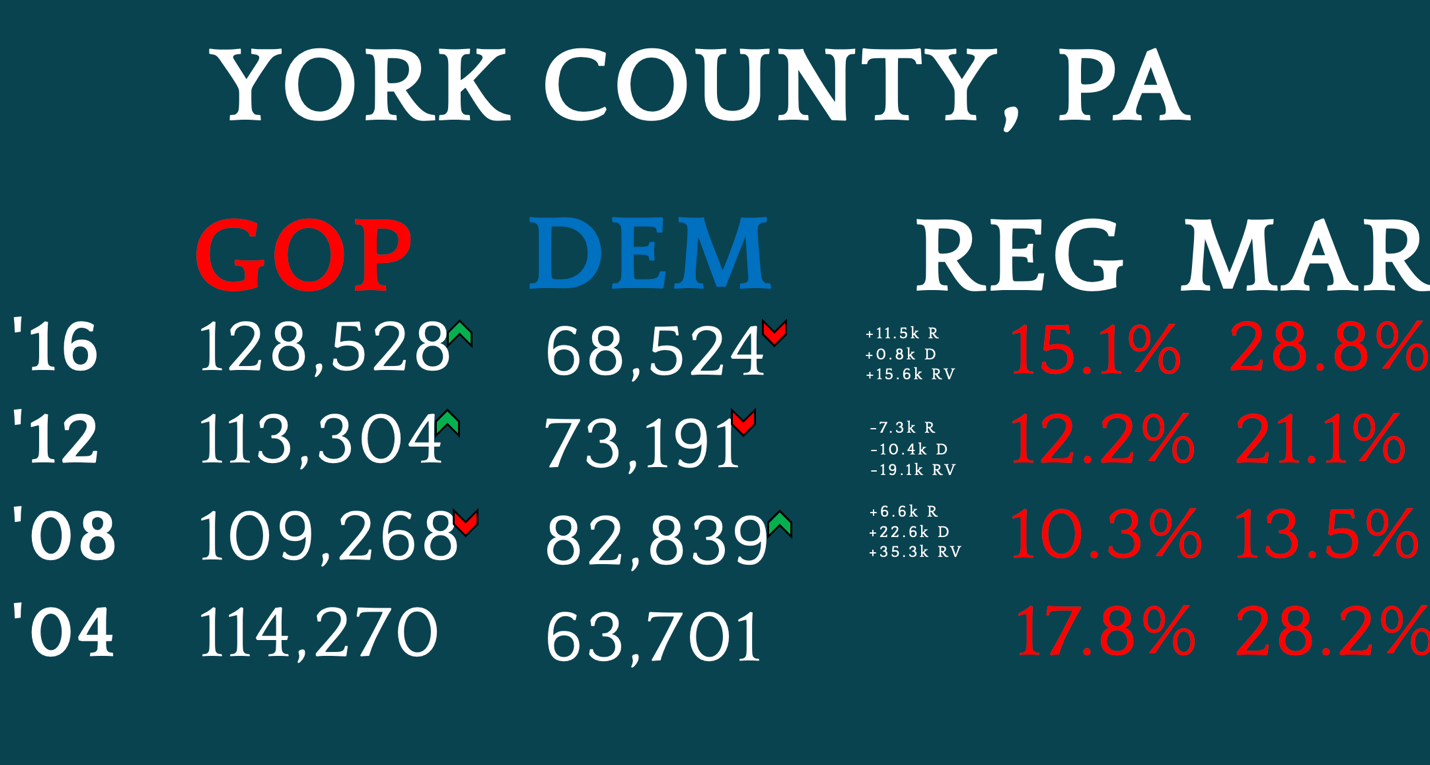
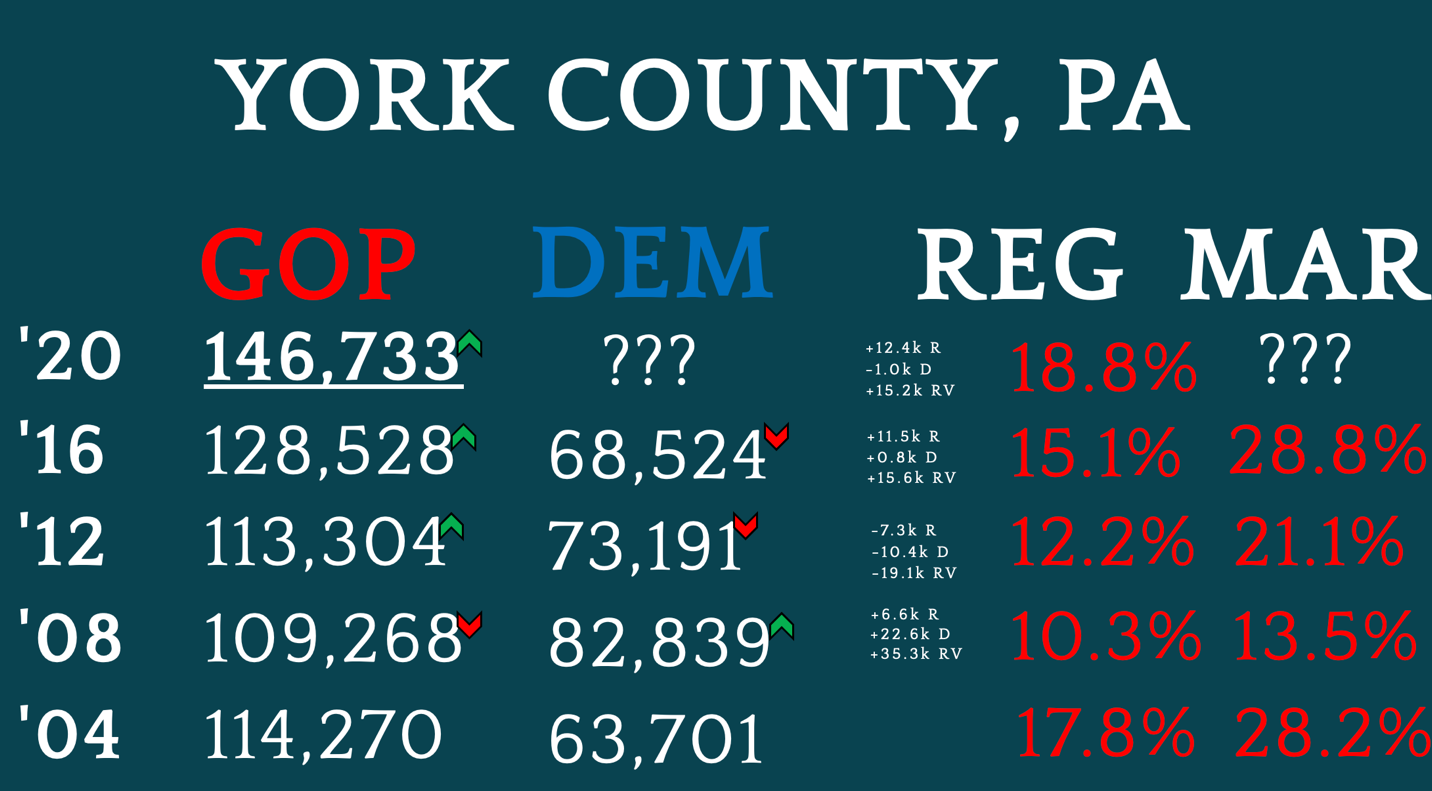
2004 – Bush +28.2%, +50,569
2008 – McCain +13.5%, +26,429
2012 – Romney +21.1%, +40,113
2016 – Trump +28.8%, +60,004
The trend leading into the 2020 election is heavily Republican, won by Trump by a higher margin than Romney, showing that York County is not an establishment Republican county backing away from Trump even from his first campaign. The county went left with the state in 2008 and showed a dip for McCain, but recovered margin over two cycles, and Trump exceeded Bush’s 2004 margin. The movement in the Republican registration advantage (“Reg” column in the graphic above) has correctly shown the direction of the margin as a predictor, even dating back before what is on the graphic. Democrat nominees are losing votes from Obama’s 2008 high point in two straight elections as Trump gains, and there is insufficient population growth to prevent that if Trump gains the same amount of net new votes in 2020. If Trump matches his previous gain, he will post 143,752 votes.
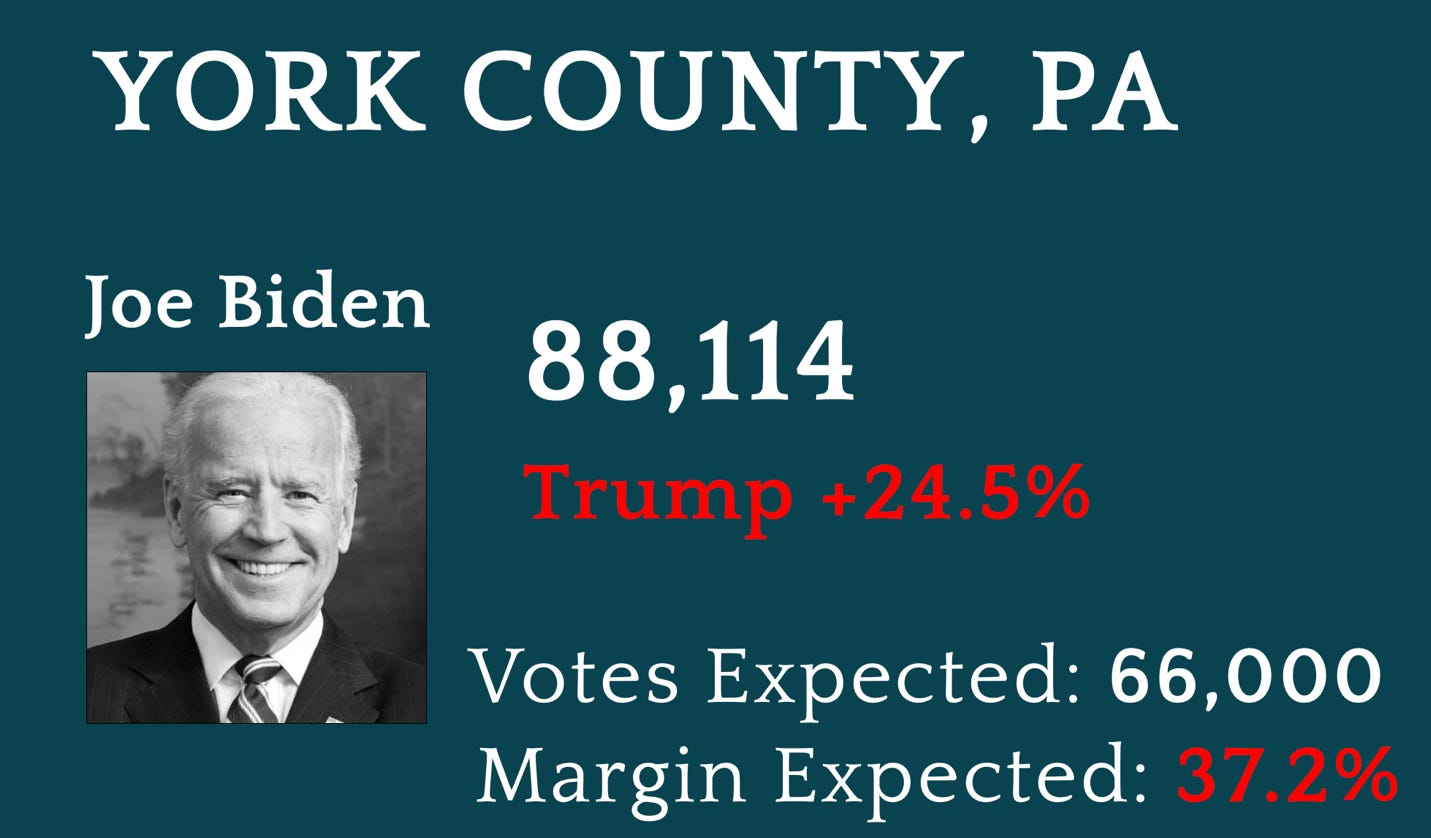
Trump came in 2,981 votes higher than what I would have considered his target number – at 146,733. Additionally, the county has an even harder Republican registration lean going into 2020 than it did in 2016, at 18.8% advantage, with a gain of roughly 12,400 GOP registrations and a loss of roughly 1,000 Democrat ones. That means we should expect Trump to win York County by more than 28.8%, and by more votes than he won by in 2016. Romney won the county by about 14,000 more votes than McCain in margin, and Trump won by about 20,000 more than Romney did. Here, knowing Trump’s 2020 vote total, party registration, and population, I would forecast Biden at 66,000 even, which is more than fair and less of a plunge than either of the past two Democrat presidential campaigns in the county. Trump at 146,733 and Biden at 66,000, with 4,299 other votes would give us 217,032 votes, or 9,003 more than cast in 2016, with Trump carrying the county by 80,733 votes, or 37.2%, in line with previous jumps based on registration trend.
3) Make Top-Line Estimate for Fraudulent Ballots (is there cheating likely?)
Final Result – Biden gains more net new votes in the county than Trump, despite the registration figures and despite the Trump vote gain exceeding his 2016 vote gain, dispelling the narrative that Republicans voted against the registration line. Trump wins the county by fewer votes and a smaller margin than he did in 2016, when he should have expanded the margin by more than 20,000, minimum, in a state decided by 80,555 ballots.
Conclusion: There are certainly fraudulent ballots, and based on my informed estimates, a likely total of 22,114 in favor of Biden.
4) Figure Out Where those Ballots are Stuffed or Inserted
York County’s data was organized for me in 161 precincts, or precinct equivalents. I classify each based on 2016 performance because it gages the response to Trump with regard to Romney’s prior performance (did it become more or less Republican?). If a precinct is new or has gone extinct, I label it as such and if either candidate has 50 or more votes in it in 2020, I usually label the fraud estimate as “null,” and it goes in gray. This is most common when large counties have clearly redrawn precinct lines, or a precinct had so much growth (think Florida subdivision) that it isn’t easy to quantify, or even practical if accuracy is my goal (and it is).
Once I have eliminated the “nulls,” I have four precinct classifications – Crimson, Republican, Competitive, and Democrat.
Crimson precincts were won by Trump in 2016 by a higher percentage than Romney won them or were won by Trump after Romney lost them in 2012. These, by rule of party registration, strongly suggest Trump should post higher margins of victory in 2020 so long as he gains an equal or greater number of net new votes. These are commonly seen as a Trump gain, and a Clinton loss in votes, like a seesaw, and that is very important in the Industrial Midwest for estimating what should have transpired in 2020.
Republican precincts were won by Trump in 2016 by a smaller percentage than Romney won them. They are usually characterized by Clinton outpacing Trump for net new votes in 2016, or even a Trump loss in votes from Romney. There are a lot of these precincts in Maricopa County and many suburban Texas counties in 2016. I am more likely to suspect this result in 2020 if the Trump vote gain is meager, or if he declines in votes from 2016; however, many of these rebounded in 2020 and went “Crimson” for Trump.
Competitive precincts are precincts lost by Trump in 2016, but in which he had at least 30% of the vote. Depending on who lives there, 2020 performance may rebound substantially. Trump won a lot of these in Hispanic areas in 2020.
Democrat precincts, on the other hand, are Trump losses with less than 30% of the vote. College campuses, reservations, inner cities, and barrios are commonly found here.
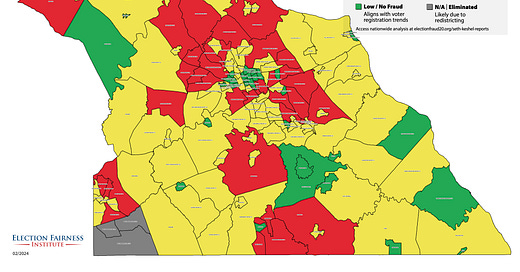
The York County precinct map shows 38 precincts in which I’ve estimated at least 125 or more fraudulent Biden votes. They are colored in red. Yellow precincts have likely mathematical indication of fraud, but likely less than 125 fraudulent ballots, and more than 50. If something is shown in green, it is classified low, and that is relative to the other precincts, not necessarily none.
Here is an example of a Crimson (Trump stronghold) precinct with a low rating:
Chanceford Township 2
Romney +44.5%, +206 votes in 2012 – 463 total votes cast
Trump +63.0%, +317 votes in 2016 – 503 total votes cast
Trump +67.0%, +389 votes in 2020 – 1,110 total votes cast
Biden is 29 votes below Obama’s 2012 performance, and Trump drew 8.2 net new votes for every one for Biden. Chanceford is off in a remote southeastern corner of York County and away from the major highways, and likely off the selected ballot trafficking routes. I would have actually expected Biden to go down from Clinton, but these are relatives estimates, and since he doesn’t exceed Obama and the trend line is intact, with a large net new vote ratio favoring Trump, it goes down low.
What is ironic about Biden’s historic performance in York County is that he did it with almost no help from York City, which contains all 14 Democrat-classified precincts in the county. I have 13 of the 14 rated low, with one rated moderate. In these 13 precincts, Trump gained a total of 676 votes from his 2016 performance, while Biden lost 504 of Clinton’s votes. In precinct York City 6-0, which Trump lost 91-8% in 2016, Biden won 78-21%, losing 135 of Clinton’s votes, and total turnout down 60 votes.
What this means is that Biden outpaced Trump, who set his own high bar for incumbent performance just like the registration statistics said he would, in the other 145 precincts not labeled “Democrat” or “New” – and they break out 117 Crimson, 21 Republican, and 7 Competitive.
Now I will show you why East Manchester Township is the worst precinct in York County in terms of how many stuffed Biden ballots there are, and why it contains a likely minimum of 450 fraudulent Biden ballots.
East Manchester Township
Romney +26.4%, +836 votes in 2012 – 3,167 total votes cast
Trump +35.0%, +1,125 votes in 2016 – 3,211 total votes cast
The 2016 result is a pure Trump trend – Trump gained 118 net new votes, Clinton lost 171. Total turnout is up less than 2%, due to population growth of just 863 in the 2010s per the latest census. This means, in line with the party registration trend in the county suggesting a Trump blowout, if Trump can gain at least 118 net new votes, we should expect that margin to continue over 35.0%, and for the township to be won by over 1,125 votes in 2020.
Trump gained 426 net new votes here in 2020. The result:
Trump +21.0%, +889 votes in 2020 – 4,225 total votes cast
Despite Trump gaining nearly four times as many net new votes in the township as he did in 2016, when he shifted it 8.6% in his direction, his 426 net new votes were swamped by 662 net new Biden votes – 1.55 net new Biden votes for every net new Trump vote. Biden is 491 votes over Barack Obama’s 2012 tally. Deducting 450 Biden ballots gives us a line like this:
Trump +35.5%, +1,339 votes in 2020 – 3,775 total votes cast
Still a little high, with Biden slightly over Obama in a Crimson-trend precinct, but advances the margin and brings total turnout to realistic levels.
And thus, there you have what you need to determine whether or not you think I’m a noisy gong, or perhaps an unrivaled election sleuth for these perilous times.
Without further ado, my mapping below, showing East Manchester Township and other hot spots right on the major highways used to facilitate ballot trafficking over an obscene 50-day window, diluting Republican margins and contributing to 67 counties worth of chaos:
York County, Pennsylvania
Top 15 Worst Precincts
Crimson Precincts
East Manchester Township
at least 450 fraudulent votes
-
Fairview Township 3
at least 400 fraudulent votes
-
Windsor Township 1
at least 250 fraudulent votes
-
Conewago Township 1
at least 250 fraudulent votes
-
Springettsbury Township 3
at least 250 fraudulent votes
-
Penn Township 2
at least 200 fraudulent votes
-
West Manchester Township 2
at least 200 fraudulent votes
-
Newberry Township 3
at least 200 fraudulent votes
-
West Manchester Township 5
at least 200 fraudulent votes
-
Shrewsbury Township 2
at least 200 fraudulent votes
-
Springettsbury Township 2
at least 200 fraudulent votes
-
Republican Precincts
Carroll Township
at least 450 fraudulent votes
-
New Freedom Borough
at least 300 fraudulent votes
-
Springettsbury Township 8
at least 200 fraudulent votes
-
Springettsbury Township 5
at least 200 fraudulent votes
Author’s Note: Imagine this sort of work stretched out over 3,143 counties and independent cities in the United States. It has taken me over three years to reach this level of detail, and I need your help remaining independent. You can help by subscribing to this journal as a paying member (much needed), or by emailing mapping@goefi.org if you’d like to sponsor the mapping of your county. Thank you!


It is quite mind-blowing that the data exists. The trends are identifiable to a disinterested or nonpartisan observer. And the fraud is quite obvious. And it’s crazy that people keep saying “no evidence of fraud” - like a kid who thinks you can’t see them if they cover their eyes and don’t see you. It’s THAT childish.
I enjoy the “truther” community. They raise a lot of interesting issues and research subjects that blow my mind because it challenges my basic assumptions about the way everything works. But I no longer listen to anyone who will not acknowledge fraud in elections. It’s to the cabal’s benefit if we’re arguing over whether the recent aurora borealis is “real” or created by testing done by HAARP, instead of talking about things that matter. Like the fact that we are not free and our elections are very, very rigged.
I think you have exposed a really clever ballot stuffing modus operandi: instead of stuffing in dem precincts where everyone expects it, instead stuff in Rep precincts by a few hundred here, a few hundred there, a few hundred everywhere. Not enough to change the outcome at the precinct level, but add ‘em all up and you have achieved your goal and avoided any detection or even suspicion. Brilliant!