Michigan 2024 Presidential Election Review
Author’s Note: All 2024 Election Reviews can be found here.
Outcome
Trump +1.4% (+80,103)
Trump +2.5% (+140,722)
Preface
With Pennsylvania poised to vote to the right of the rest of the three “blue wall” battlegrounds (despite the tendency of Wisconsin to vote the furthest right of the three), and North Carolina, Arizona, and Nevada looking good in the run-up to the election, Trump could have won without Georgia, Wisconsin, and Michigan. In fact, many pundits foresaw Trump carrying Pennsylvania and Wisconsin, but not Michigan. The Great Lakes State hasn’t voted right of Pennsylvania since 1988, and Michigan, Nevada, or Wisconsin usually occupied the lists of battleground states many pundits and analysts figured were most likely to back Harris.
Michigan is Pennsylvania’s political cousin, only with a slightly smaller population and four fewer electoral votes (15, compared to Pennsylvania’s 19). The first thing that made it clear to me that Michigan would be drifting right from its highly corrupted 2020 result (Biden +2.8%) was the massive partisan shift in the Keystone State in favor of the Republican Party, which you can read about here. Michigan does not register its voters by party, so my next best option is to infer the likely registration shifts off Pennsylvania’s, and consider the historical fact that the two states have shifted together in the same direction in every presidential election since 1948. They had also shifted with Florida in the same direction since that year in a streak that suddenly snapped in 2020, when Florida became 2.2% more Republican, and Pennsylvania and Michigan ran off to the left for Biden (a big tell that things weren’t on the up and up).
Pennsylvania’s registration numbers made it obvious the state was moving right – the question then was, “by how much?” I arrived at my prediction of Trump +2.5% in Michigan by first pegging Pennsylvania at Trump +2.8% and working left from there. Michigan was this many ballots to the left of Pennsylvania in each of his two runs leading into this election:
· 2016 33,588
· 2020 73,633
· Average 53,611
Setting 2024 turnout by total votes equal to 2020’s and deducting the average of 53,611 from Pennsylvania’s margin I arrived at Trump +140,722, or +2.5%. Unfortunately, thanks to the capacity to cheat, we may never know where the two states should sit in relation to one another. Michigan is by far the most inherently corrupt of the battlegrounds, and has more than 83% of its population registered to vote, when only 77% of any population is over the age of 18, and therefore old enough to vote. This means hundreds of thousands of ineligible entries appear on the rolls, in a state already exposed for harboring voter registration fraud rings in many of its population dense counties. That was the only caveat for me making any allowance at all for Trump to be deprived of Michigan’s electoral votes in the now infamous New York Times article panning my picks and methodology. In the run-up to the election, I questioned why Michigan was even allowed to participate in awarding electoral votes with such an obvious level of corruption in the voter roll that was so bad, it received public scrutiny.
Analysis
· Michigan wound up sitting 40,163 ballots left of Pennsylvania this year, alarmingly close to its average of the first two elections and between the two values in both of Trump’s previous efforts in Michigan.
· 77 of 83 (92.8%) counties in Michigan shifted toward Trump in terms of percentage margin, meaning he either won them by a higher percentage than he did in 2020 (or flipped them in the case of two counties), or lost them by a smaller percentage. The most notable shift occurred in Wayne County, home to core Detroit and much of the surrounding area, which no Republican presidential nominee has won since 1928. Trump made up 9.2% there, moving 84,445 ballots in margin and holding Harris to the lowest Democrat vote share (62.5%) in the county since 1992.
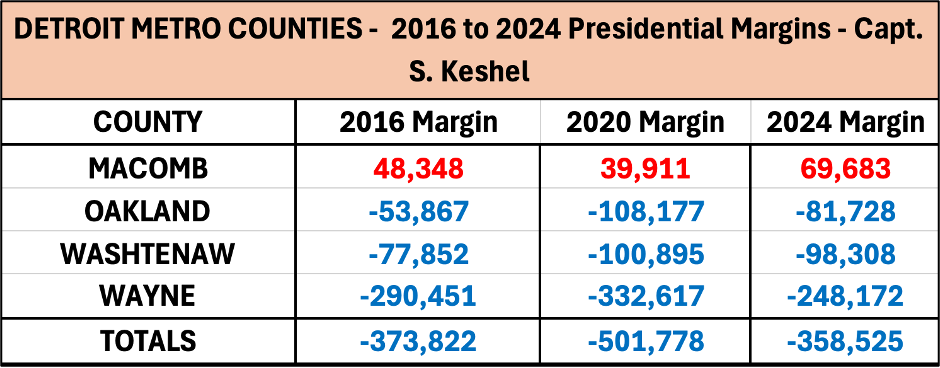
· Trump’s gains in Wayne County were the product of lower urban turnout, primarily the relaxing of major ballot harvesting activities present in 2020, plus his own inroads with minority communities, such as Arab Americans, which won him the City of Dearborn in one of the biggest surprises of the election cycle. Here are the margins for the past three cycles in the four main counties making up the Detroit metro area, a nationally recognized Democrat stronghold:
· Referencing the chart above and accepting that Harris’ ballot totals are inflated and retain much of the “fortification” present in the 2020 race, Trump over-performed his deficit from his winning statewide 2016 campaign by 15,297 ballots, and most notably in Wayne and Macomb Counties. His improvement in Oakland County marks a significant move rightward for this cycle, but still puts him far left of his 2016 deficit. Wayne County had, by far, the biggest collapse in Democrat support, down 10.1% and 60,138 ballots since 2020, which underscores the volume of election manipulation present there in 2020, the loss of minority support, and a potential planning oversight given that there are surprising Democrat gains elsewhere in the state. Here is how the Detroit metro compares to the outlying 79 counties in Michigan over the past three cycles:
· I correctly predicted Trump would flip Muskegon and Saginaw Counties, and narrowly missed out on predictions he would flip Kent (which he won in 2016) and Genesee Counties. Trump’s win of Muskegon was the first GOP presidential win of the county since 1988, although he should have carried it in a fair 2020 race.
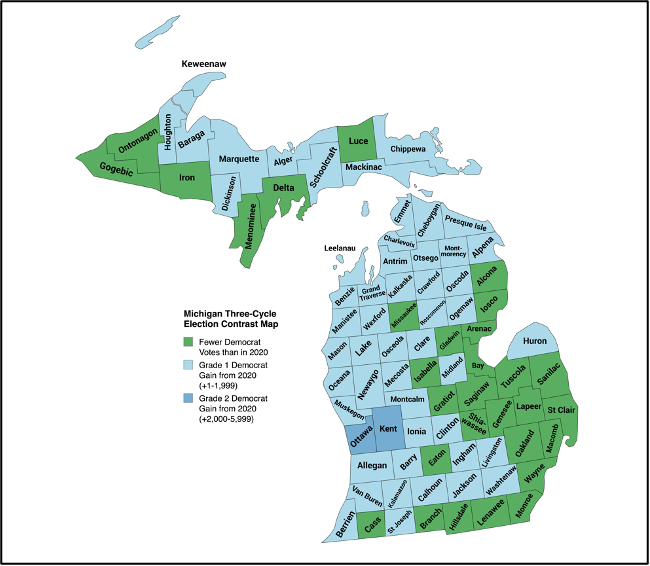
· Harris gained ballots over Biden’s totals in 53 of 83 counties, including sizable gains in both Kent and Ottawa Counties in western Michigan. She lost ballots from Biden’s count in 30 counties but failed to dip below Hillary Clinton’s totals in any counties, although she lagged Clinton in 13 Indiana counties, 33 Illinois counties, and 38 counties in Ohio. Her gains were contiguous throughout almost all western Michigan, but she lagged Biden in eastern Michigan. This suggests an over-performance among ballot harvesting operations in the west, and an underperformance, combined with organic minority vote shift to Trump, in the east in a state that counted nearly 2 million absentee ballots (down from 2020). See map below outlining counties with gains and losses:
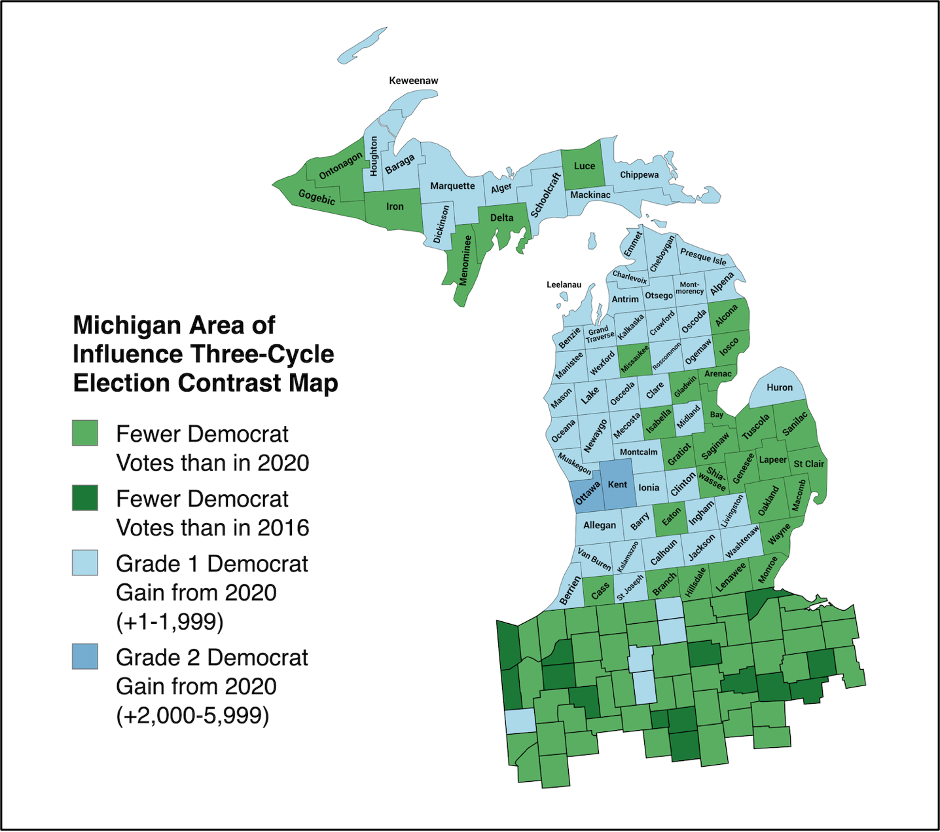
· Now, contrast that map with a map contrasting these counties in Michigan with all counties in Indiana lying north of the Indianapolis suburban counties, and all counties of northwest Ohio, excluding any suburban counties of the Cleveland, Columbus, or Dayton metro areas:
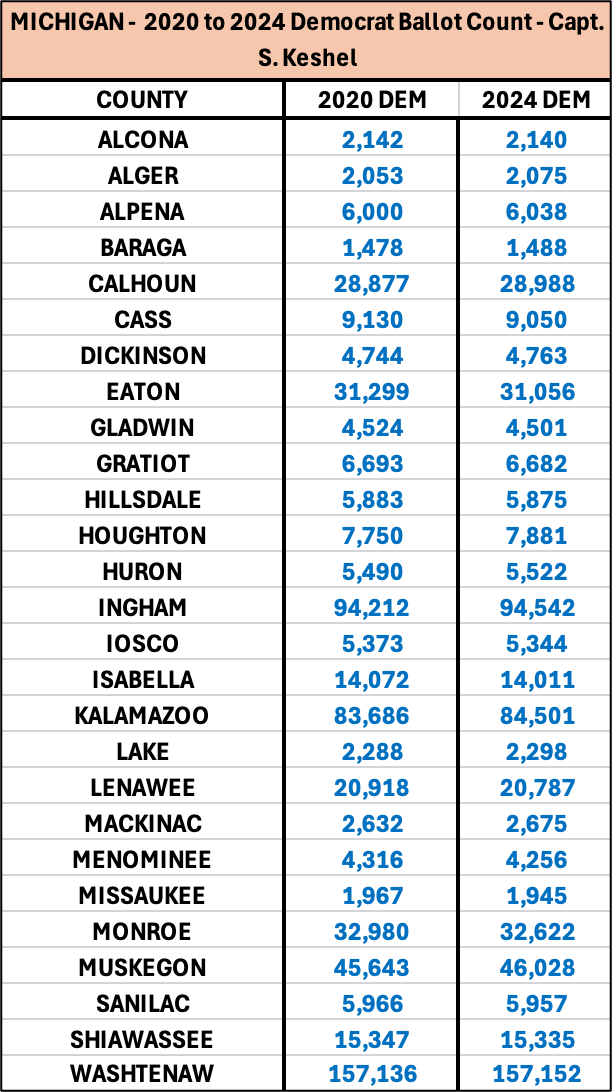
· In comparing Michigan’s ballot data to Pennsylvania’s, particularly from smaller counties, it appears Democrats have mastered ballot scraping in the state, and in the key states of the Midwest as a whole. It appears they can identify vacant registrations, blanket them with mail-ballot requests, and spend the early voting window gathering the ballots to make nearly identical collection counts in successive elections. Here is a selection of 27 counties, mostly rural or small, that produced nearly identical ballot counts from the 2020 election, and in some cases, resisted political trends that left similar counties in other states drastically reduced in terms of Democrat vote count:
· Macomb County, a collar county of Detroit and large manufacturing center that was key in flipping Michigan to Trump in 2016 most resembles Pennsylvania’s Allegheny County, which I believe produces more counterfeit ballots than any county in the Keystone State, including Philadelphia County. While it slightly lagged its 2020 Democrat ballot count by 4.0% (-8,975), given Trump’s gains there and the overall trends in like counties, it would appear Macomb has held on to most of its counterfeit 2020 ballot count. Here are similar losses from regional industrial counties, as featured in the Pennsylvania report outlining Allegheny County’s likely corruption:
o Erie County, NY loss of 18,169 (-7.0%)
o Cuyahoga County, OH loss of 39,792 (-9.6%) – lowest Democrat ballot count since 2000
o Lucas County, OH loss of 9,091 (-7.9%) – lowest Democrat ballot count since 1996
o Mahoning County, OH loss of 7,005 (-12.2%) – lowest Democrat ballot count since 1932
o Marion County, IN loss of 26,053 (-10.5%)
o Lake County, IN loss of 15,784 (-12.6%) – lowest Democrat ballot count since 2000
o Cook County, IL loss of 278,152 (-16.1%) – lowest Democrat ballot count since 2004
Keep in mind, Macomb County is losing population since 2020 according to estimates and should not be capable of sustaining such a high Democrat vote count in the face of massive Trump gains and a working-class swing heavily in his favor. The Democrats may have their entire margin of victory in the U.S. Senate race contained entirely within Macomb County.
Quality Checks
Statewide Presidential Ballot Count
Keep reading with a 7-day free trial
Subscribe to Captain K's Corner to keep reading this post and get 7 days of free access to the full post archives.


