Yesterday, I put a statistical artillery shell downrange that sparked an inferno on X, thanks in part to our friend George Behizy. In my initial posts on this subject on my three major social media channels, I said the following:
Some gold unearthed by the Precinct Mapping Project and local leader Ken V. for Henrico County, VA, 2020 election results:
Precincts over 100% turnout
Randolph - 115% (426 votes/326 registered)
Spottswood - 113% (1260/1111)
Monument Hills - 111% (1270/1120)
Hunton - 111% (1174/1060)
Rollingwood - 105% (2096/1989)
Longdale - 105% (1941/1853)
Elko - 105% (786/751)
Derbyshire - 104% (2081/2004)
Lauderdale - 100% (2494/2484)
Antioch - 100% (1976/1970)
My estimate for Henrico was 15,572 fraudulent votes for one particular candidate.
George shared that initial post, and then we received major hate (surprise) from the tolerant American left, who claimed they debunked my supposedly false claims with basic Internet search techniques.
Why force my opinion down your throat when I can simply provide the material for you to make an informed decision?
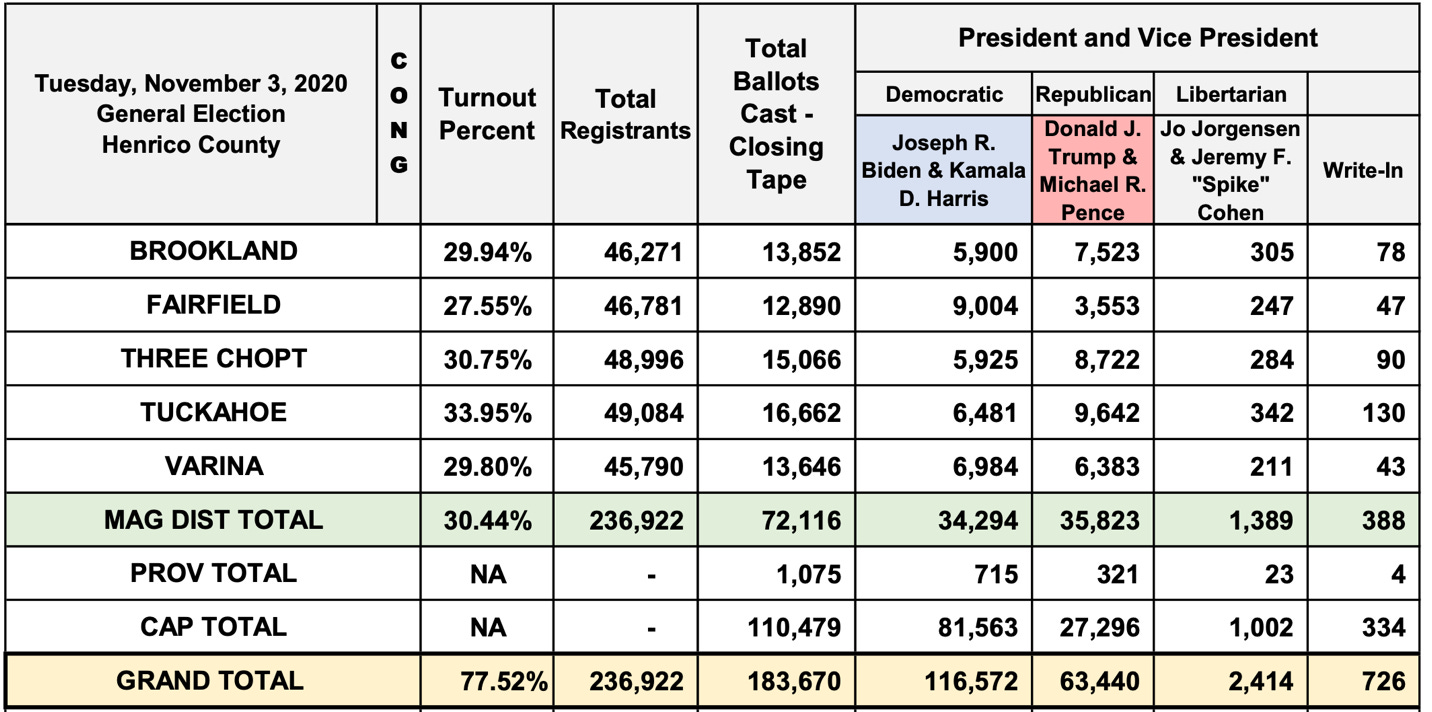
Here are the total votes certified for Henrico County, Virginia, in the presidential quasi-election of 2020:
2020 183,670
Biden 116,572 (63.7%)
Trump 63,440 (34.6%)
Other 3,140 (1.7%)
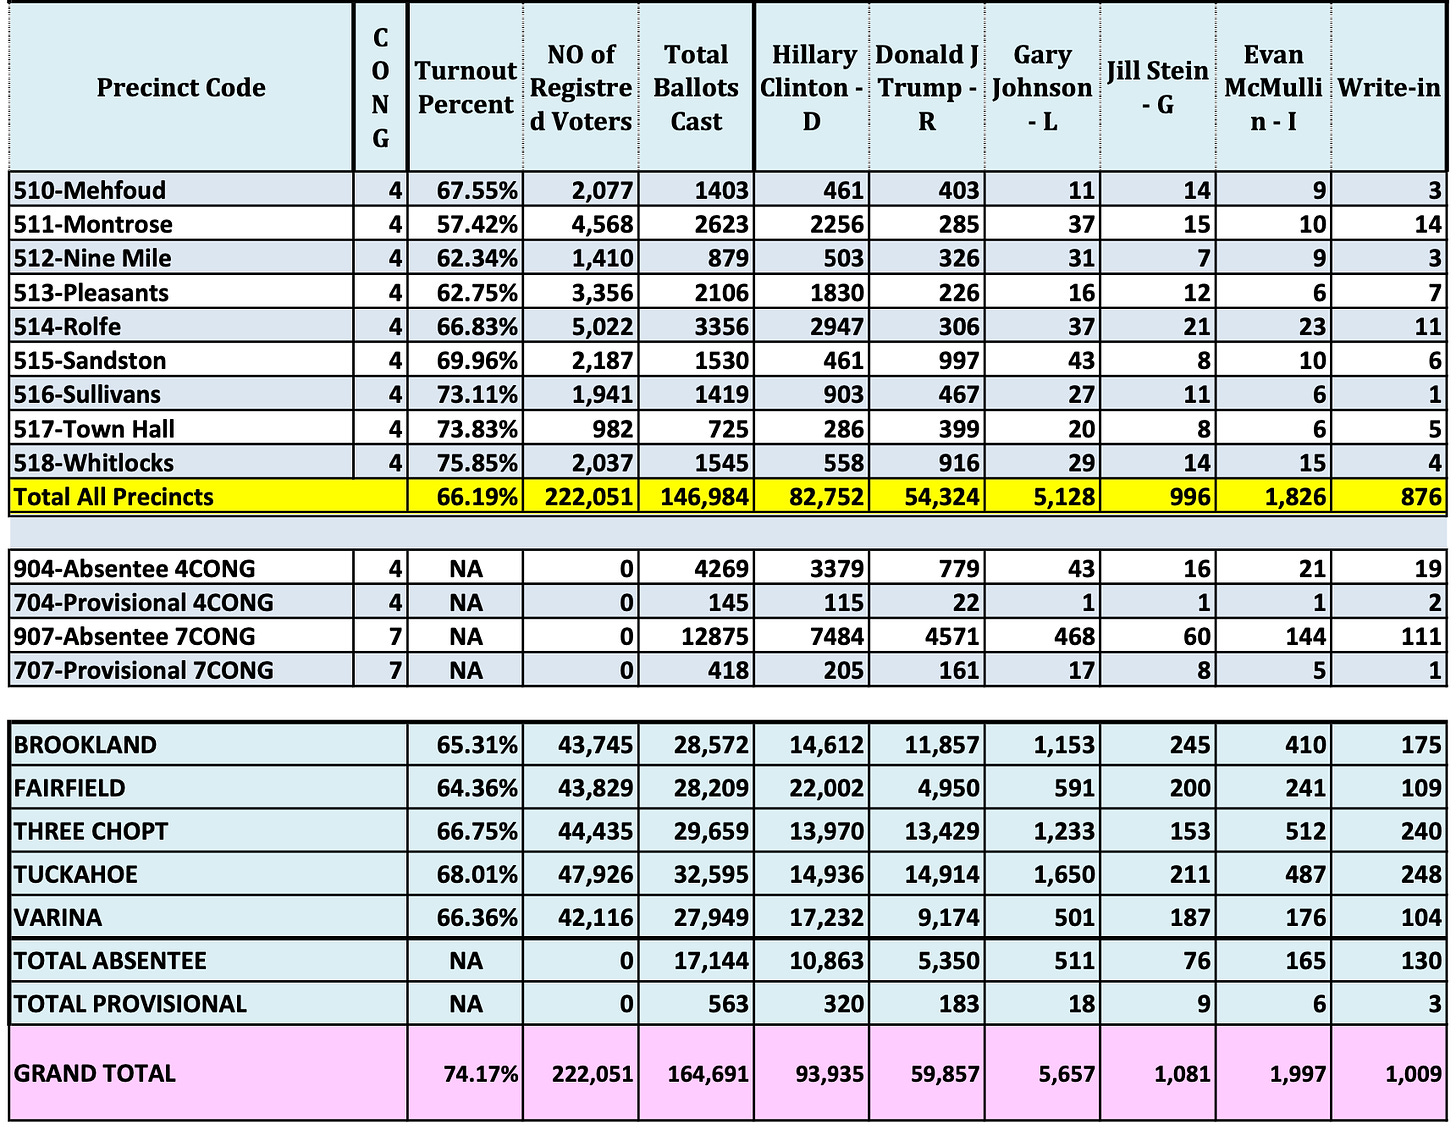
Now, for 2016:
2016 164,691
Clinton 93,935 (57.4%)
Trump 59,857 (36.6%)
Other 9,744 (6.0%)
Use these links for reference for the following exercise.
2020 Henrico Certified Results
2016 Henrico Certified Results
It is a matter of indisputable fact, using Henrico County’s own numbers, that the county reports 18,979 more ballots cast in 2020 than in 2016. That is not the issue here, nor is the gripe centered on the supposed results.
Using your links, let’s have a look at a few precincts with the assumption that 18,979 more votes cast four years later will contribute to higher vote totals reported in the precinct columns.
Derbyshire
Votes Cast in 2016 (Voters Registered)
1,471 (1,886)
Turnout 78% (1,471/1,886)
-
Votes Cast in 2020 (Voters Registered)
884 (2,004)
Turnout 44.1% (884/2,004)
Rollingwood
Votes Cast in 2016 (Voters Registered)
1,426 (1,892)
Turnout 75.4% (1,426/1,892)
-
Votes Cast in 2020 (Voters Registered)
842 (1,989)
Turnout 42.3% (842/1,989)
Monument Hills
Votes Cast in 2016 (Voters Registered)
816 (1,101)
Turnout 74.1% (816/1,101)
-
Votes Cast in 2020 (Voters Registered)
500 (1,120)
Turnout 44.6% (500/1,120)
Hunton
Votes Cast in 2016 (Voters Registered)
778 (1,019)
Turnout 76.4% (778/1,019)
-
Votes Cast in 2020 (Voters Registered)
518 (1,060)
Turnout 48.9% (518/1,060)
Wow, that “Captain K” guy is a real nut. Can’t he even see, look here’s the link, that not only did those precincts not go over 100%, they didn’t even hit 50% turnout? What a loser!
Look, folks. I’m not sure the left is intelligent at all, and that probably explains why they vote for the rancid garbage that they willingly inflict upon themselves and others. Let me get this straight – the county has 18,979 more votes reported for 2020 than they did for 2016, but turnout is down roughly 30% in the sample precincts, which is consistent throughout all of Henrico’s precincts?
What changed?
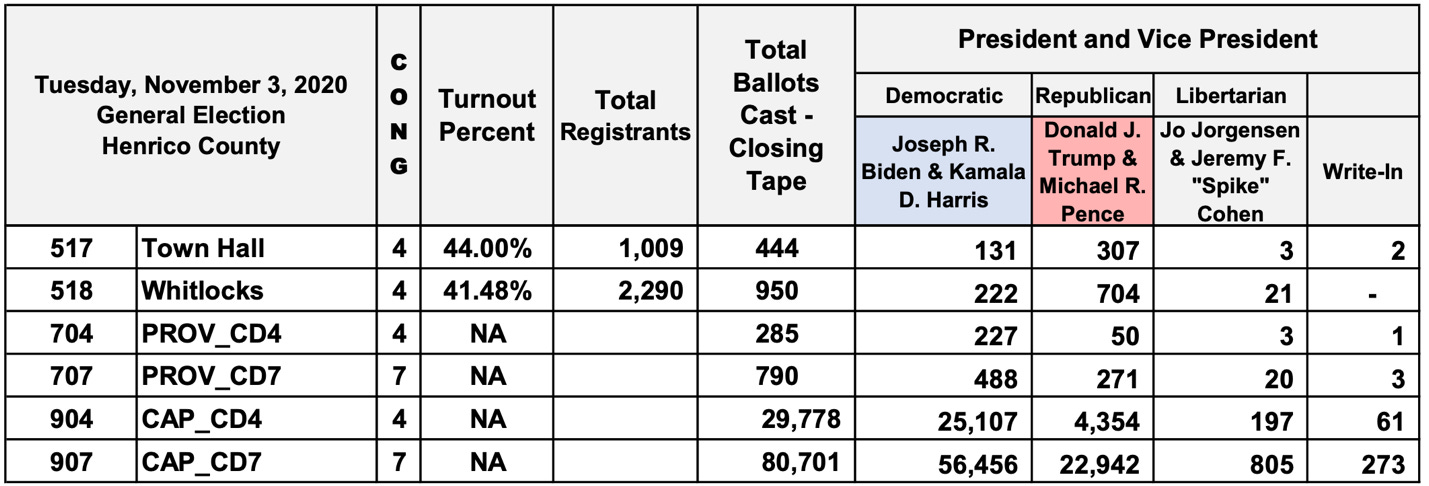
The 2020 absentee scam, that’s what. Tucked deep into the Henrico totals in both links there is a final absentee column – 17,144 in 2016 (10,863 for Clinton, 5,350 for Trump) – and 110,479 in 2020 – an increase of more than sixfold that went 81,563 for Biden and 27,296 for Trump – three to one.
My lone concession is that Henrico removed absentee ballots from the 2016 precinct counts, as well; however, the drastic increase in absentee ballots, combined with a scan initiated by the Precinct Mapping Project, two databases operated by a 17-year old genius who has been assisting me with my research, and the scratch paper research of a local patriot named Ken V. got to the truth.
If the screeching left wants to take issue with me, then they should actually take issue with two subscription based research databases – Redistricter and Dave’s Redistricting Atlas. These two databases have been the workaround for counties that conceal absentee data by removing the counts from the precincts in which the supposed voters who cast these ballots are registered to vote (notably, these registrations are recorded in the precinct and used in the county’s own calculation to artificially drive turnout down, when in fact it is sky-high considering all means of balloting).
Derbyshire
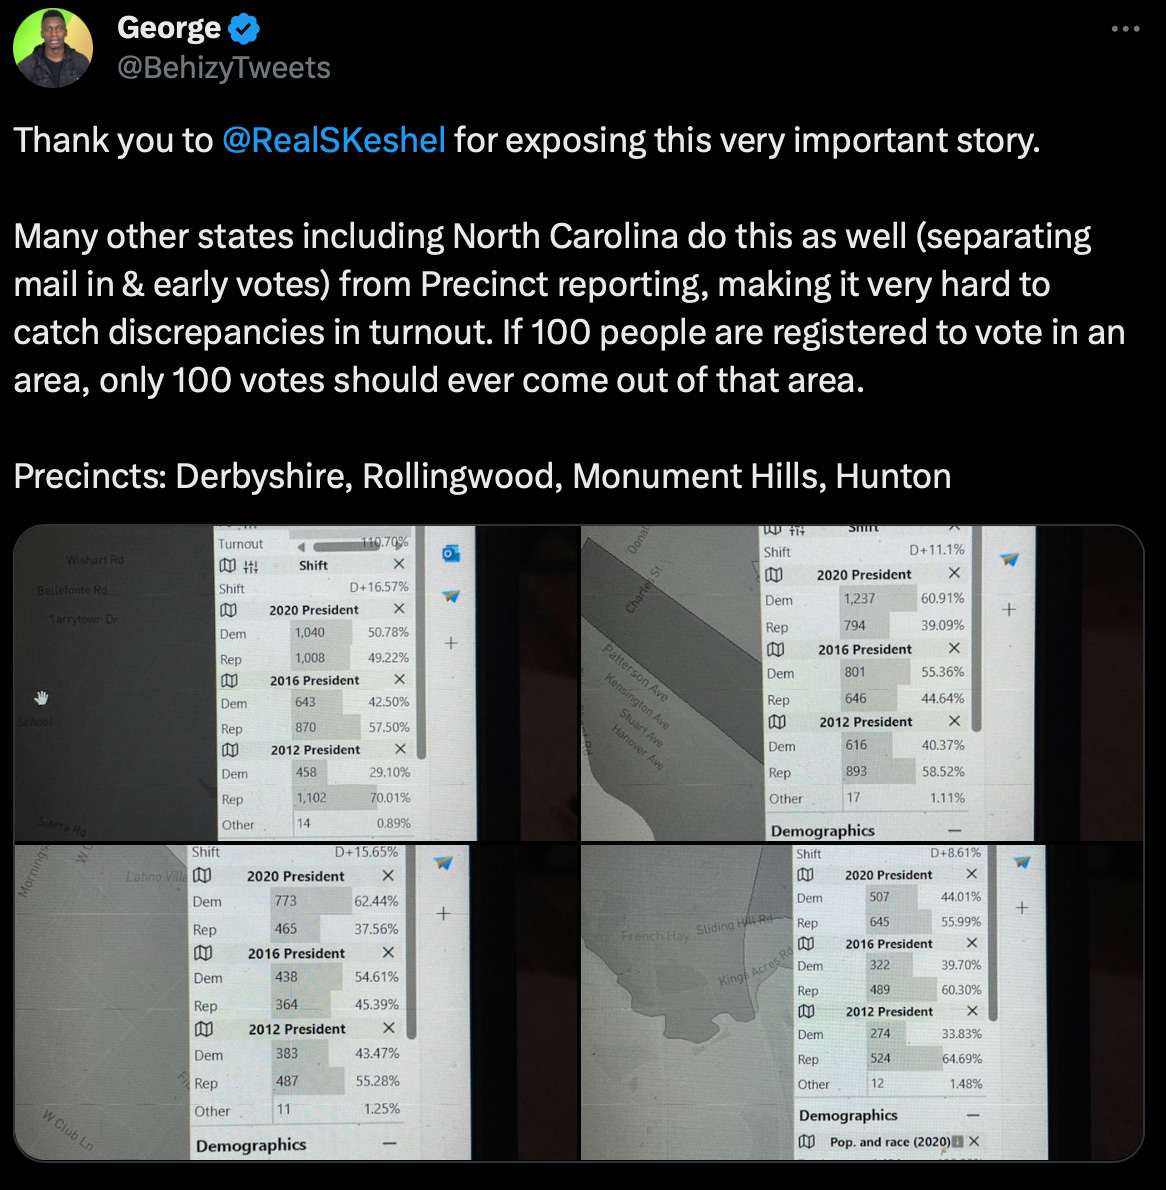
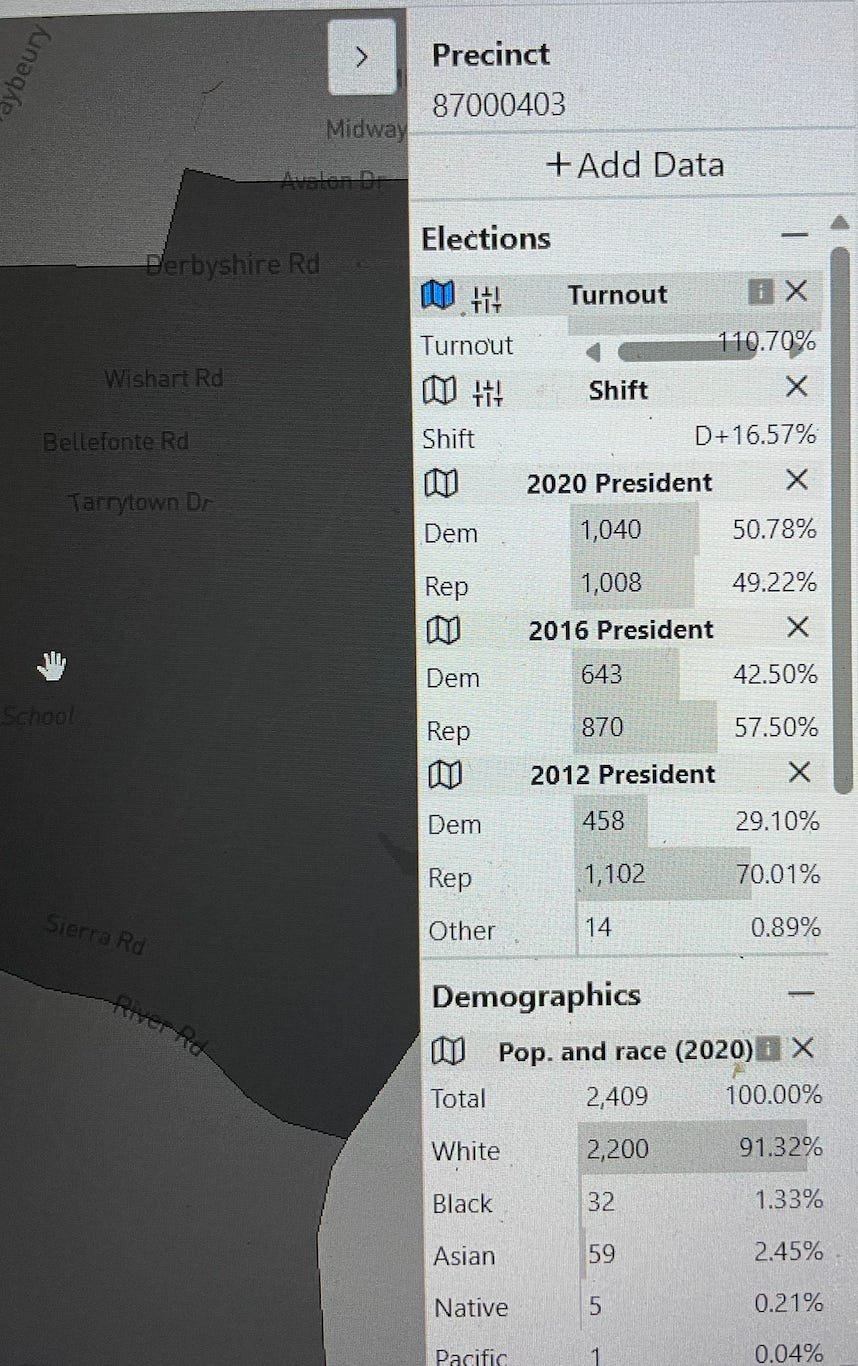
The county’s voting records from 2016 align with the reflected 2016 totals from Redistricter shown above, with 90.1% of the total presidential vote accounted for in the precinct data, and total turnout at 86.6% (1633 votes/1886 registered - high, but with precinct demographics, believable).
In 2020, the county reports 884 votes for Derbyshire precinct. Redistricter and Dave’s Redistricting Atlas, with slightly different total numbers thanks to the lack of transparency afforded by the county and/or state, give us a total of 2,081 (1,005 to 1,008 for Trump, 1,040 to 1,043 for Biden, and roughly 33 other votes). 2,081 votes compared to 2,004 registrations (per the county) comes out to 103.8% turnout. Note – the Redistricter app shows turnout of 110.7% - for this exercise, I am using the county’s own statistics for voter registration and the working assumption that they are concealing absentee votes from precinct counts for a purpose. Redistricter’s turnout number of more than 110% matches almost perfectly with Derbyshire’s registered voter count from 2016 if divided into the 2,081 certified votes from 2020.
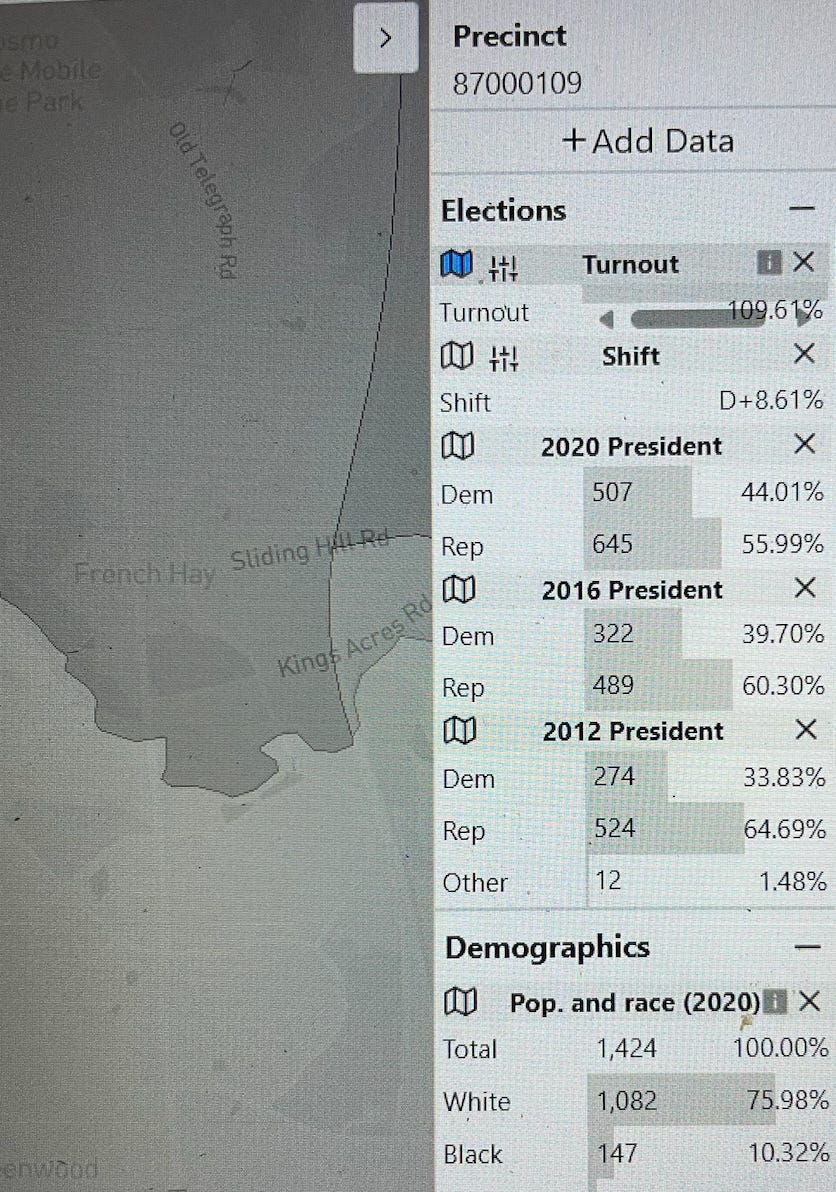
The other three precincts in this sample, Rollingwood, Monument Hills, and Hunton, give the same feedback:
Rollingwood
1,600 votes/1,892 registered in 2016
84.6% turnout
2,096 votes/1,989 registered in 2020
105.4% turnout
-
Monument Hills
909 votes/1,101 registered in 2016
82.6% turnout
1,270 votes/1,120 registered in 2020
113.4% turnout
-
Hunton
870 votes/1,019 registered in 2016
85.4% turnout
1,174 votes/1,060 registered in 2020
110.8% turnout
Conclusion
It seems I did make one mistake. I understated the turnout in Monument Hills in my initial post on this subject and in the outrage over truth being revealed, have apparently unearthed a monstrosity I have long suspected was lurking around out there. Counties are concealing precinct data by removing the supposed absentee ballots, one of the main methods of defrauding election returns, from the precinct counts. This is not the case in every state or county, but it is prevalent on the East Coast, and in some red states like North Carolina.
The same impact occurs when a county, usually urban, redraws its district lines and makes it impossible to pick up the trend trail and spot discrepancies like this, because tens of thousands of voters, and their tens of thousands of real and fake votes, are scrambled together in unrecognizable and untraceable fashion. El Paso County, Colorado, is a prime example here.
We spend a lot of time talking about obvious things that have serious merit – voter rolls, machines, tabulation equipment, mail balloting, and ballot harvesting. Record keeping is yet another dimension by which voters are being deceived and deprived of due transparency. Imagine an audit of a Fortune 500 company using similar methods to cover up corporate expense abuse, such as the CEO buying vacation homes with company money, or salesmen abusing the expense budget by putting in thousands of dollars in untraceable expenses. There would be hell to pay. These four precincts are not alone in Henrico County – thoroughly disproven, the left will seek to dispute the two databases used to consolidate the missing data that was lodged into an overall bucket for absentee votes for the past two presidential elections, but the truth remains that every vote belongs to a supposed registration – and these registrations are accounted for at the precincts according to Henrico’s own data. Someone has the data of where those ballots came from, and to which voter they belong – and my estimation is that Redistricter and Dave’s Election Atlas have the scent of the trail.
Author’s Note: This took a lot of time and effort to compile and verify, and it is free to all readers because it must be known to all who care about election integrity and reform. That is part of my promise to never put essential information behind a paywall; however, my mission is self funded, and your paid contributions keep it moving. I would be grateful if you subscribed as a paying member, and if you are interested in having your county mapped as part of the Precinct Mapping Project, please email our team at mapping@goefi.org. Thank you!




Captain, my head is spinning! God has blessed you with the great capacity to decipher data, among other gifts, and I believe it is for this place in time. I am thankful that I heeded your encouragement to become a paid subscriber, thus having access to your work. I am able, then, to share your articles with our county patriot group. Thank you, Sir, and God bless you. I am praying for you.....
This appears to be consistent with what others have concluded about the deliberate and in some cases ILLEGAL changes to voting processes in several key states that flipped Trump's obvious victory in 2020 to a shocking "win" for Biden but with an extremely suspicious and irreconcilable vote total of 81M. Fraudulently created / filled-in paper mail-in (or absentee) ballots are the key to utilizing deliberately falsified voter registration databases. Fix the fraudulent databases and 3/4 of the problem is solved. But unsolicited mail-in ballots must be eliminated and the old, more reliable absentee ballot process, where I.D. / residence verification is possible beforehand, should be tightened up to preclude any widespread abuse.