I’m not an election denier, as ordained by our friends in the mainstream media. I am simply one fraud affirmerout of many tens of millions in the United States today, and hundreds of millions around the world suffering under the most destructive presidential administration since the inception of that office. I have always offered my findings freely and am willing to be proven wrong. In fact, if I were proven wrong, a lot of people would be put at ease, because then we would have confidence our elections are run with integrity, and the results that come from them are trustworthy and acceptable and would indeed confirm that Americans are willingly voting for their own demise.
My method is called The Keshel Method. Unlike the magicians and sorcerers in the press and in most polling organizations, my methodology encompasses the basic blocking and tackling of election forecasting.
“But he never shows his numbers!”
Each county has only so many votes it can reasonably contribute to either political party, and those quantities are predictable based on the following:
*trend in margin
*political science
*population change (growth, decline, stagnation)
*voter registration
*voter registration trend by party (if available)
*past single-cycle vote growth (by party and collectively)
Donald Trump was elected in 2016 primarily because of a coalition shift in the Industrial Midwest (Rust Belt) and Upper Midwest. The Democrats believed they had the electoral college locked up, but my guess is they had cut off the 2004 Republican victory map (true) and believed it would hold; much to their chagrin, Trump outflanked them and carried three states not won by the Republican nominee since the 1980s – Pennsylvania, Michigan, and Wisconsin, to get over the top.
The key county I am going to bring to your attention today is Westmoreland County, Pennsylvania, one that Trump would rely on to provide a yuge margin en route to what appears to be a massive victory in the Keystone State in 2020. The Keshel Method does not disregard statistical information prior to 2004, but generally begins analysis in that year, trending it through to the present day for the viewer’s understanding. 2004 represents the last gasp of the 1980s-era GOP, and the ensuing years account for the rise and fall of Obama, the rise of Trump, and provide context for what should have happened in 2020, in any reasonable predictions.
Westmoreland County lies just to the southeast of Allegheny County, which is home to metro Pittsburgh. Westmoreland is parts suburban and rural and has a heavy population of non-college white voters, many of whom are still registered as Democrats, and has trended more Republican in every election since 1996, when Democrat Bill Clinton won it by 1.1%, a reduced margin from his win there in 1992. Westmoreland voted for the Democrat nominee for President in every election between 1932 and 1996, with 1972 being the lone exception (Nixon’s national landslide).
The county peaked in population in the 1980 census at 392,294 and has dropped population in every census since. It is now at 354,663, down more than 10,000 since the 2010 census. That means that the total number of votes is highly unlikely to climb drastically, and when the voters of one party start voting for the other, a major shift in margin occurs (because the losing party is not able to replace its voters with major population influx).
2004
Incumbent President George W. Bush won re-election and lost Pennsylvania by just 2.5%, a tighter finish than his 4.2% defeat in 2000.
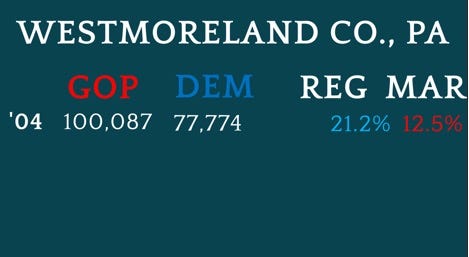
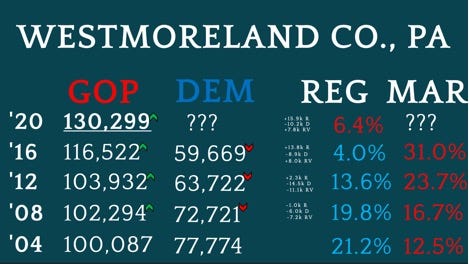
The results in Westmoreland are below, with Bush having a victory margin of 12.5%, or 22,313 votes, which is up from 5.8% and 9,066 votes in 2000. That means Westmoreland County had a Republican trend of 6.7% (12.5% - 5.8%) in 2004. The Democrats held a 21.2% party registration advantage at the time of the 2004 election in the county. With the heavily Republican result, this means “Reagan Democrats” have a Republican preference, at least in federal elections.
Total votes in 2004 election, all parties = 178,696
2008
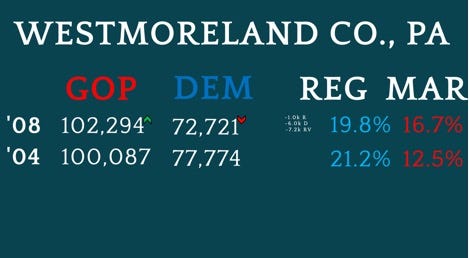
Pennsylvania moved nearly 8 points left in 2008 when Barack Obama appeared as the Democrat nominee, but many counties in western Pennsylvania, which relies heavily on resource extraction and has been negatively impacted by trade deals, trended more Republican. Westmoreland continued its GOP trend, as shown by the 2008 results below.
The predictor that this would be the case is the registration data, which now reflects “just” a 19.8% advantage for the Democrats. Since 2004, both parties had lost registrations (the county is declining in population), but the Democrats lost 6,000 compared to just 1,000 for the GOP. The roll itself shrank by over 7,200. With an improved voter registration advantage for Republicans, the result in the election follows, with McCain carrying the county by 4.2% more than Bush did (Republican trend), at a margin of 16.7%, and 29,573 votes. Despite a small gain for McCain, Obama had more than 5,000 fewer votes than Kerry in a county abandoning its Democrat loyalty.
In an election that represented a Democrat wave statewide, Westmoreland didn’t budge for Obama, the gold standard for Democrat enthusiasm, and instead became more Republican.
Total votes in 2008 election, all parties = 177,547
2012
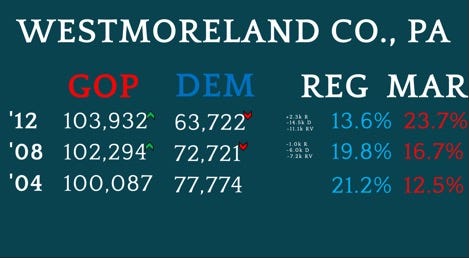
Mitt Romney was perhaps the poorest fit for the non-college white working-class voter the Republicans have fielded in history, but that didn’t matter in Westmoreland County. Romney managed to cut Obama’s margin in Pennsylvania nearly in half because working-class voters abandoned Obama in droves; unfortunately, Romney, unlike Trump four years later, couldn’t pull them into his column. He gained fewer new votes than McCain, but Obama dumped another 8,999 votes from the Democrat column, to push the GOP winning margin up to 23.7% (a 7.0% trend from 2008). Romney’s vote margin is 40,210, and the bigger winning margins were predictable thanks to party registrations. In 2012, the Democrats held just a 13.6% registration advantage, and dropped over 14,500 since 2008. That trend once again aligned with an improved performance for the party receiving the benefit (Republicans).
Total votes in 2012 election, all parties = 169,572
2016
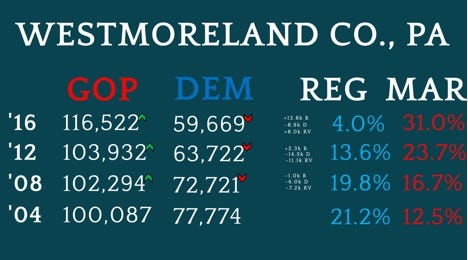
Pennsylvania flipped to the Republican electoral column for the first time since 1988, and 62 counties became more Republican in terms of margin of victory, or decreased margin of defeat under Trump. Westmoreland was no exception, and the results were devastating for Hillary Clinton. Trump, with 63.5% of the county’s vote, gained nearly 13,000 votes over Romney, and in keeping with registrations moving nearly 10 points more Republican (this time with nearly 14,000 more Republicans registered, and a loss of nearly 9,000 Democrats), the margin again followed the registration trend. Westmoreland went to Trump by 31.0%, and by 56,853 votes. With this trend replicated throughout interior Pennsylvania, Clinton had no chance.
Trump drove voters to the polls for him, reversing decline in total votes present since 2008. Note that the increase in turnout in the middle of a coalition shift did not benefit Democrats in terms of total votes received.
Total votes in 2016 election, all parties = 183,492
2020
With Pennsylvania in Trump’s 2016 column, and the state 3 percent more Republican in registrations (Republicans out registered Democrats in Trump’s term at a 21:1 ratio), Westmoreland also became much more Republican, showing a 6.4% registration advantage for the Republican Party, which is incredible considering the historical Democrat legacy. This time around, the GOP registered nearly 16,000 more voters, while the Democrats lost over 10,200, which is more for both parties than the 2012-2016 window.
To make matters worse for Biden, Trump gained 13,777 votes, which is more than he gained in 2016, when the county became 7.3% more Republican in results.
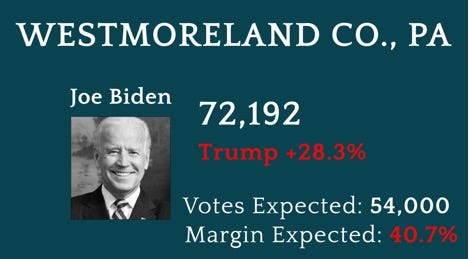
Based on all available inputs, including Trump’s vote total, I predicted in hindsight Joe Biden should have no more than 54,000 votes, especially considering that Democrats have not added a single net new vote since the 2004 election in a county decreasing in size, and with the Democrat Party having lost nearly 40,000 registered voters in four cycles.
Instead, Joe Biden came up with a gain of 12,523 votes, all but wiping out Trump’s monumental gains.
Summary
2004 Bush +12.5%, +22,313 margin
Total votes = 178,696
2008 McCain +16.7%, +29,573 margin
Total votes = 177,547
2012 Romney +23.7%, +40,210 margin
Total votes = 169,572
2016 Trump +31.0%, +56,853 margin
Total votes = 183,492
2020 Trump +28.3%, +58,108 margin
Total votes = 205,330
My forecast for 2020 is that Joe Biden could have no more than 54,000 votes. That would put the 2020 number at:
2020 Revised Trump +40.7, +76,299 margin
Total votes = 187,138
Trump supposedly lost Pennsylvania by 80,555 votes, after days of counting counterfeit absentee ballots. With what appears to be 18,192 minimum fictitious votes in Westmoreland County, nearly one quarter of the margin between Biden and Trump statewide can be found in this one county. We are led to believe Westmoreland County, despite the record Trump gains, the 10-point Republican registration shift, the hemorrhaging of Democrat voters from the registration rolls, and a decrease in population somehow still yielded a Democrat gain nearly as steep as Trump’s, as if all new registered voters were tech workers imported from San Francisco.
Lest you think my work is cherry-picked, I’ve done this intensive analysis in every single one of our 3,143 county equivalents nationwide, and they point to the same conclusions – that Trump-won counties were shaved to reduce margin of victory and make final outcomes believable, and that Democrat-won counties were artificially inflated to produce as much margin as possible. As always, I am more than happy to have someone prove me wrong, not by recounting fake ballots, but by auditing ballots to see if they were cast by real, living human beings that somehow defied established trends in the middle of a working-class coalition shift in one of the nation’s most critical battlegrounds.
Author’s Note: Westmoreland County’s administrators don’t give a damn, at least not yet. But they will continue to have to answer for the maladministration of the county’s elections, because Westmoreland is another 5.6% more Republican than it was in 2020, and will continue in that direction until 2024 gets here. Getting that message across in writing and in person is not free, and if you’re able, I’d greatly appreciate you becoming a paid subscriber of my work. Thank you.


truly amazing information and for your work, Captain Keshel, we are in your debt.
Paid subscriber, wish I could do more!! Keep up the good work! Best wishes from the United Kingdom now owned by the CCP and World Economic Forum.