Polling is on the way out. Not only do we have major media outlets contradicting themselves with assessments and forecasts that make no sense, like Arizona going blue but Nevada red, with Trump several points up in Pennsylvania and losing Wisconsin, but we also have record levels of apathy toward participating in or believing polls altogether. I wrote this up last week when I showed just how far the August 2020 poll outcomes were from the fraudulently certified results less than three months later.
The malpractice present in mainstream polling, in tandem with fraudulent election outcomes validating fraudulent pollsters, has unfortunately harmed the reputations of the few honest pollsters still in business because it makes them wrong. Trafalgar was all over Trump carrying the Rust Belt in 2020, despite floods of pro-Biden polls released for no other reason than to sell the steal. Despite the horrific, response bias heavy polls released since Kamala Harris’s voteless coronation, polling data still show some hidden gems, even though the top lines are configured however they are ordered. For instance, Trump carrying 17-20% of black voters and coming within 10% of winning Hispanics, while winning men by a larger margin than Harris wins women, does not compute with a Harris win, especially in states in which black or Hispanic voters not producing Dem-heavy margins is a death knell for her, like in Georgia or Arizona.
With polling unreliable and all over the map, primitive methodology is necessary to understand the trajectory of this year’s presidential race. Sometimes that methodology interacts with big chunks of data, like how Iowa going to Trump by mid-double digits or higher is a dead giveaway that Wisconsin polling is way off (as always), meaning Trump would have to try to lose the Badger State on purpose not to carry its 10 electoral votes. In other instances, the data become granular, and I get into it at the county level, sometimes down to the precinct equivalents. Let the reader understand that, thanks to the inaction of Republican officials and legislatures and the deliberate obstruction by their Democrat counterparts, Trump will have to win a quasi-election to find himself back at 1600 Pennsylvania Avenue on January 20 next year; therefore, there are no guarantees, nor is this my attempt to give you hopium to get you through the next few months. It is merely a field guide and insight into how my mind processes election data in the brave new world of quasi-elections.
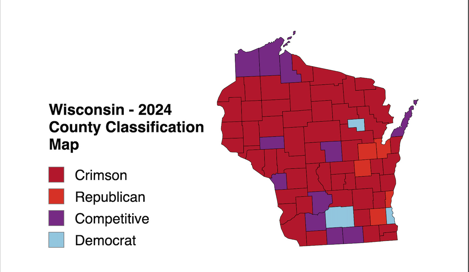
You may have recently read why I think Trump will carry Wisconsin, and why I think Michigan may be lost, and I’m making this post to explain to you my 2024 county modeling. It will be useful for not only figuring out where Trump is in the hunt, but also which areas are likely most loaded out with election fraud – which is saying something, since it would be gaging election fraud over the insane 2020 levels present in the totals. I will link this page in each state forecast I release, so here goes, using Wisconsin as an example:
Crimson Counties
Counties that were won by Trump in 2020, and that have given increasing Republican margins since at least 2016, if not 2012. Their modern high point for Democrat vote count was almost exclusively found in 2008 for Barack Obama in his first run. Many of these were flipped Republican by Trump in 2016 after Romney had lost them four years prior.
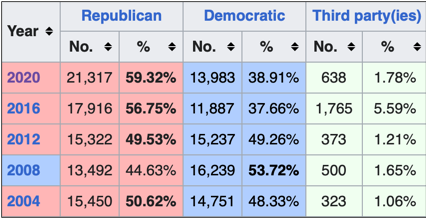
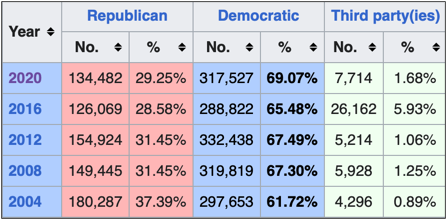
My example is Chippewa County, in northwest Wisconsin:
Biden received 13,983 ballots in the certified county totals, which I believe is high based on the 2016 Clinton count, and Trump’s massive vote increase in 2020; however, 2020 opened up many channels for election cheating and ballot gathering, and I believe the 13,983 Biden ballots, still substantially fewer than Obama’s 2012 count, will be Harris’s maximum since things won’t be as optimal for her as they were for Biden, even organically. Simply put, I would look very suspiciously, so long as Trump makes his predictable gains (see graphic above), at any Harris vote tally over 13,983.
Making the forecasted count of registered voters produce a similar turnout as 2020, I arrive at an estimate of 23,100 Trump votes to 13,983 for Harris, increasing Trump’s margin by 1,783 this time around, or 61.2% to 37.1%. It is very possible she will fail to meet the high Biden mark not only in this Crimson county, but in the other 52, as well. If that happens, Trump is on his way to a comfortable win.
Remember, before Harris can exceed the Biden total in these Crimson counties (or any counties, for that matter), she will have to collect all the fraudulent ballots from 2020 that contributed to his number, then try to build off of that. I do not believe Biden’s vote tally is etched in stone as a starting point.
Republican Counties
Counties generally won by Trump in 2016 by a decreased margin from Mitt Romney, but also counties derailed by election fraud in 2020 that Trump still won, such as Brown County.
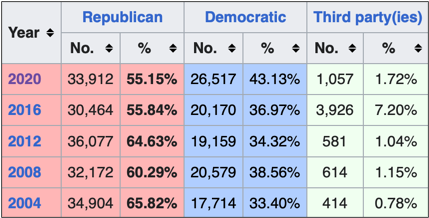
My example is Ozaukee County, in southeast Wisconsin:
Thanks to decreased turnout and a large third party vote share in 2016, Trump lost more than 11 percent margin of victory from Romney in 2012, and then almost 7 more points in 2020 with Biden making a gain up to 26,517 ballots, with little Trump growth, showing a clear trend away from the GOP.
While this may rebound for Trump, I’m baking it in so there is nothing but upside from here. Averaging Democrat gains since 2012, I peg Harris for 30,200 votes, and with Trump matching his own gain in 2020, the red column at 37,500, marking a slight but manageable tick leftward from 2020.
Competitive County
Any county in this category represents a Trump 2020 loss, but with at least 30% of the vote in 2020. I expect Trump to improve in all 11 in 2024, with some flipping Republican for the first time in decades.
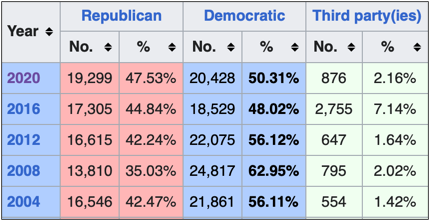
My example is Portage County, which hasn’t backed a GOP presidential nominee since 1956, though Trump pulled within 3 points in 2020:
This one fits the rule of Crimson, with 20,428 appearing to be Harris’s lid and Trump conservatively on pace for 20,600 and the flip. The working-class counties in Wisconsin, unreplenished by Automatic Voter Registration fraud opportunities, will have a difficult time not declining from Biden’s boosted totals.
Democrat Counties
Simply put, these are counties Trump lost in 2020 with a certified share of less than 30% of the vote. There are three in Wisconsin – Menominee, Milwaukee, and Dane.
Milwaukee County, for example:
For a variety of reasons, which include a decline in Democrat black vote share, the collapse of the county’s population and voter roll, and Trump’s likely improvement, I find it difficult to imagine Harris exceeding 325,000 votes in Milwaukee County, making the county roughly a wash, or even a net gain for Trump from 2020 in the most pessimistic case.
Conclusion
My modeling discards polling unless I can find consistent crosstabs data that corroborates what primitive data suggest – like improving minority vote shares or Trump-resistant Republican counties of the past returning home by which I may slightly enhance or diminish my forecast for either candidate. Now you will know what these county types are as I begin going through the seven decisive states with my findings.
Modeling each state down to the county requires hours of research to compile vote totals, registration numbers, and forecastable 2024 metrics that help me arrive at the final tally. Please consider subscribing to this journal as a paying member if you’d like to follow a sane alternative to insane polling.
Seth Keshel, MBA, is a former Army Captain of Military Intelligence and Afghanistan veteran. His analytical method of election forecasting and analytics is known worldwide, and he has been commended by President Donald J. Trump for his work in the field.




Thank you, Seth!! You are right where you need to be. You're here during this turbulent & difficult time in our nation's history providing clarity, facts, extensive research and encouraging us to get involved with our local elections. Thank you doesn't seem adequate to describe how grateful I am for you. You're a blessing.
Dear Capt. Seth- I recently had the pleasure of finding your Substack blog and am very glad that I did. I have read about your work and am delighted that someone with your skills is seriously working on the most important election of my lifetime.
I am wondering if you are familiar with Jay Valentine's Omega 4 America and the work that he is doing with his fractal technology. Since I am not a tech person by any means, I have no idea if it is effective or not, but it seems as though it is able to identify fake voters by their fake residences. In other works, there are many thousands of "voters" who are registered at parking lots, UPS, Walmart, etc. who should be removed from the rolls ASAP.
Could you please let us know if you ever use this tech or if you have any thoughts about it?
We are coming down to the wire and the DemonRats have their cheating machine all ready to go.,
Thanks for your service!