Many are unable to wrap their minds around the sheer audacity of there being over 155 million total votes cast in 2020 for the two main party candidates. There were just 130 million cast in 2016 between Trump and Clinton, and Trump’s 2020 gains were astonishing, particularly when viewed in the context that no incumbent president has gained votes from previous election and lost since Cleveland did so in 1888.
One of the go-to media misdirection plays for justifying such ridiculous “turnout” is to cite the unprecedented number of “voters” casting mail-in ballots in 2020. This would make sense in states like Arizona, Georgia, Pennsylvania, Michigan, Nevada, or Wisconsin, but why would we see massive turnout spikes in states that have voted exclusively by mail for many election cycles?
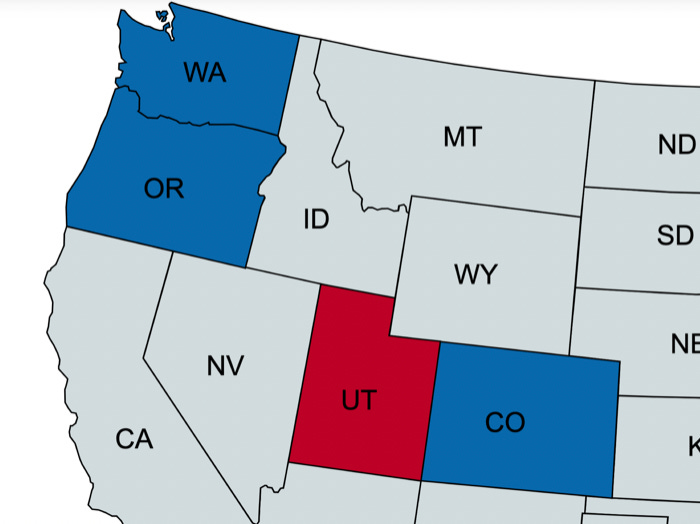
All eyes are upon Washington, Oregon, Utah, and Colorado in this analysis, with the focus on increase in turnout from Vote By Mail (VBM). You will understand why I see Washington, Oregon, and Colorado as potential 2020 Trump states by the end of this article.
WASHINGTON (First Presidential VBM in 2012)
2004 Total Votes – 2,859,084
2008 Total Votes - 3,057,054 (+197,970; +6.9%)
2012 Total Votes (VBM) – 3,125,516 (+68,462; +2.2%)
2016 Total Votes (VBM) – 3,317,019 (+191,503; +6.1%)
2020 Total Votes (VBM) – 4,087,631 (+770,612, +23.2%)
Turnout for the apathetic Romney v. Obama race was up just 2.2% with the advent of full mail-in balloting in Washington. The jump in turnout in 2016 was like the gain from 2004 to 2008, which corresponded with the peak of Obama’s political prominence. The boom in turnout for 2020 in a state well entrenched in mail-balloting is four times that of any high in the 2004 to 2020 trend cycle, enough to have Joe Biden win the state by more than Clinton won it by in 2016, concealing the massive Trump boom in Washington. Even if we double the previous record jump in turnout to accommodate the media narrative, there are nearly 400,000 more votes cast than would be reasonably forecast.
________________
OREGON (First Presidential VBM in 2000)
2004 Total Votes (VBM) – 1,836,782
2008 Total Votes (VBM) – 1,827,864 (-8,918; -0.5%)
2012 Total Votes (VBM) – 1,789,270 (-38,594; -2.1%)
2016 Total Votes (VBM) – 2,001,336 (+212,066; +11.9%)
2020 Total Votes (VBM) – 2,374,321 (+372,985; +18.6%)
Oregon’s turnout was in decline since 2004, even in 2008, in which most states had a boost thanks to Obama’s emergence. Motor Voter became law in time to impact the 2016 election, which is likely showing some degree of manipulation related to previous trends. In 2020, President Trump posted massive gains in suburban Portland, but they were washed away by the serious turnout increase statewide for Biden, despite 30 of 36 counties showing a Republican registration trend leading into the election. There are nearly 161,000 more ballots than the large turnout increase of 2016, calling into question the validity of the race.
________________
COLORADO (First Presidential VBM in 2008)
2004 Total Votes – 2,130,330
2008 Total Votes (VBM) – 2,401,462 (+271,132; +12.7%)
2012 Total Votes (VBM) – 2,569,518 (+168,056; +7.0%)
2016 Total Votes (VBM) – 2,780,247 (+210,729; +8.2%)
2020 Total Votes (VBM) – 3,256,980 (+476,733; +17.1%)
What a strange coincidence, that Colorado not only turned blue in their first full VBM election in 2008 but stayed blue and has now reached double-digit loyalty status with the blue nightmare machine. Jena Griswold, Colorado’s corrupt Secretary of State, wants no audits because she knows they will reveal what is obvious in the display above – that a state with long-standing mail-balloting had a burst in turnout that made Obama’s 2008 eruption look like a dribble because professional ballot mules harvested Colorado until it was picked clean of ballots mailed to the entire corrupt voter roll.
________________
UTAH (First Presidential VBM in 2016)
2004 Total Votes – 927,844
2008 Total Votes – 957,590 (+29,746; +3.1%)
2012 Total Votes – 1,019,815 (+62,225; +6.5%)
2016 Total Votes (VBM) – 1,131,430 (+111,615; +10.9%)
2020 Total Votes (VBM) – 1,488,289 (+356,859; +31.5%)
There were 770,754 ballots cast in 2000’s Bush v. Gore race in the Beehive State. It took 16 years and four presidential election cycles for another 360,000 ballots to pile up, giving 2016’s Trump v. Clinton race a total of just over 1.13 million; that increase was child’s play, because the same net gain occurred over just one cycle, giving 2020 the most obvious bloat of any of these four focus states. Utah is being artificially manipulated into a purple state, come hell or high water, even though Trump’s vote total is in keeping with a standard Republican’s, with full consolidation of the LDS vote he struggled to garner in 2016, when the political cartel stood up the phony Republican, Evan McMullin.
________________
Takeaways:
VBM is used to control state election outcomes, generally solidifying blue states and tipping purple ones to the blue column. This tells why Pennsylvania Democrats are pushing hard for VBM, and why the COVID scare was pushed to accommodate for mail-in “elections” across the country.
VBM, mules, drop boxes, and ballot harvesting all go hand in hand.
Washington, Oregon, Colorado, and Utah show clearly that the media using the excuse of “more people voted by mail, so Biden’s vote totals are justified” is complete nonsense. All four states have predictable or explainable turnout totals leading into 2020, while having put VBM into play in at least one election cycle beforehand.
VBM must be severely restricted if America’s election systems are to be repaired.


More great analysis! Thanks again for keeping us all in the fight.
- CDR Pete Greenwald, USN, Retired
Midlothian, VA
This is some scary sh*t. Once a state gets a few Dems in power in just the right places (like SoS), they can take over and make it a permanent Blue stronghold. I don't see how these states can ever be wrangled back, once the VBM is in place.