Inside the Census Bureau's Corruption of the Electoral College and U.S. House
Topic: Elections
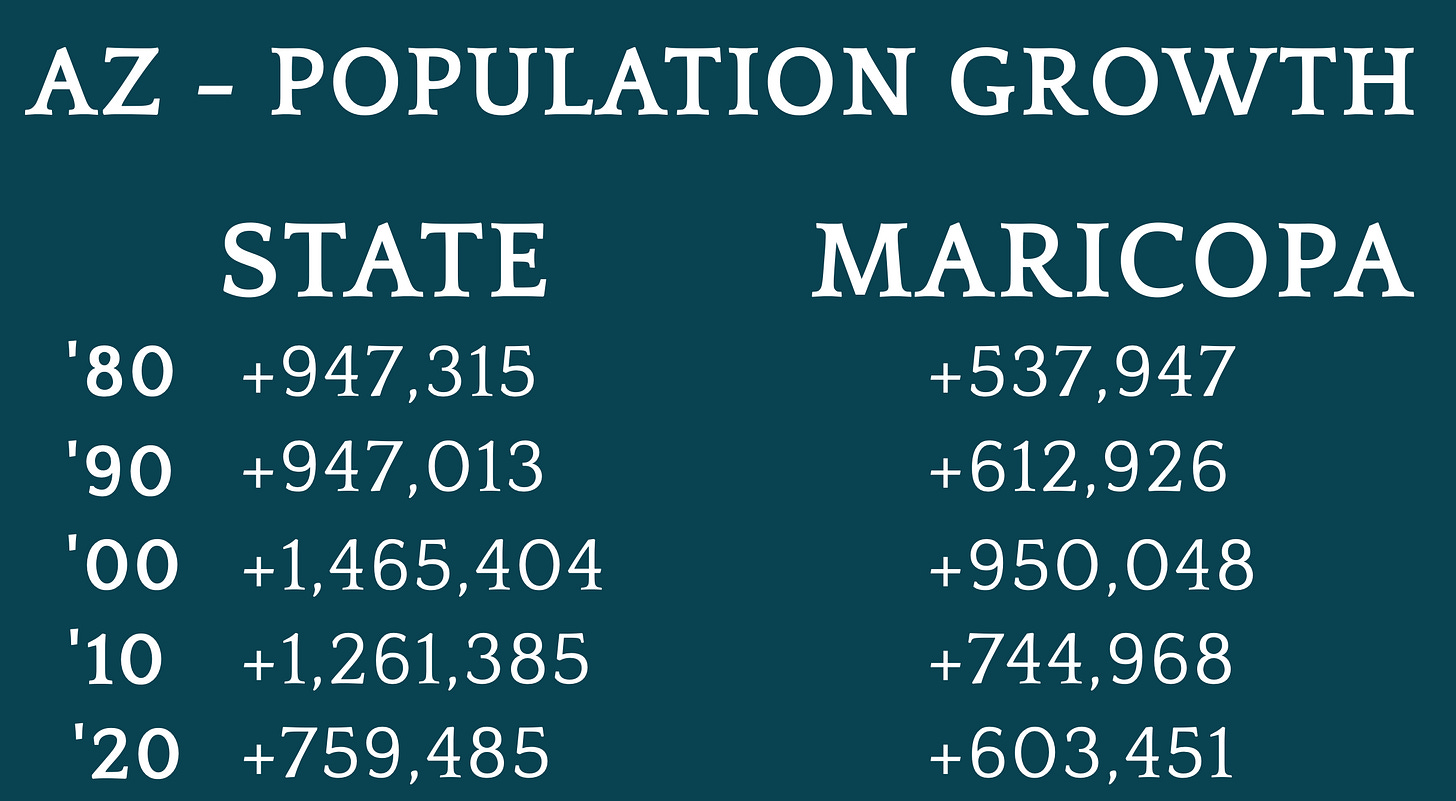
As I’ve documented recently, Arizona’s election picture takes a mysterious dive into the bowels of data reconciliation hell when considering its population trends over five decades. The state, and its largest county, Maricopa, has been soaring in population growth since the 1970s, but supposedly hit a brick wall in the 2010s, despite all firsthand accounts to the contrary. I revealed this right off the bat in my appearance before the Arizona Senate on February 23 (move to the 1 hour, 17 minute mark of the linked video).
Even with clear suppression, Trump’s certified electoral college slate from 2020 is now worth three more electoral votes than it was then, up to 235 electoral votes from 232. COVID-mania made it clear to everyone that blue state prisons were hemorrhaging population, and in fact, California lost net population, officially, in 2020 for the first time since 1900, and has done so in the two years since. Other lockdown-loving states lost citizens in droves, with many fleeing places like New York, New Jersey, Connecticut, Michigan, and Illinois.
This raises the question – just how widespread is the lie about our census numbers? Census numbers are critical to the electoral integrity of the nation, given that the Method of Equal Proportions uses them to derive the distribution of 538 nationwide electoral votes between the 50 states and Washington, D.C. All states, regardless of size, are allotted one elector per Senator (two electors), and one elector per representative, of which the smallest states have one, making the minimum electoral value of a state equal to three electors.
-
My Hypothesis
Reported population growth is being suppressed in Republican or Republican-trending states to limit electoral representation of an emerging America First populist coalition, and population loss is not accurately captured in Democrat states to limit or prevent loss of electoral representation in those states.
-
Showing the Work
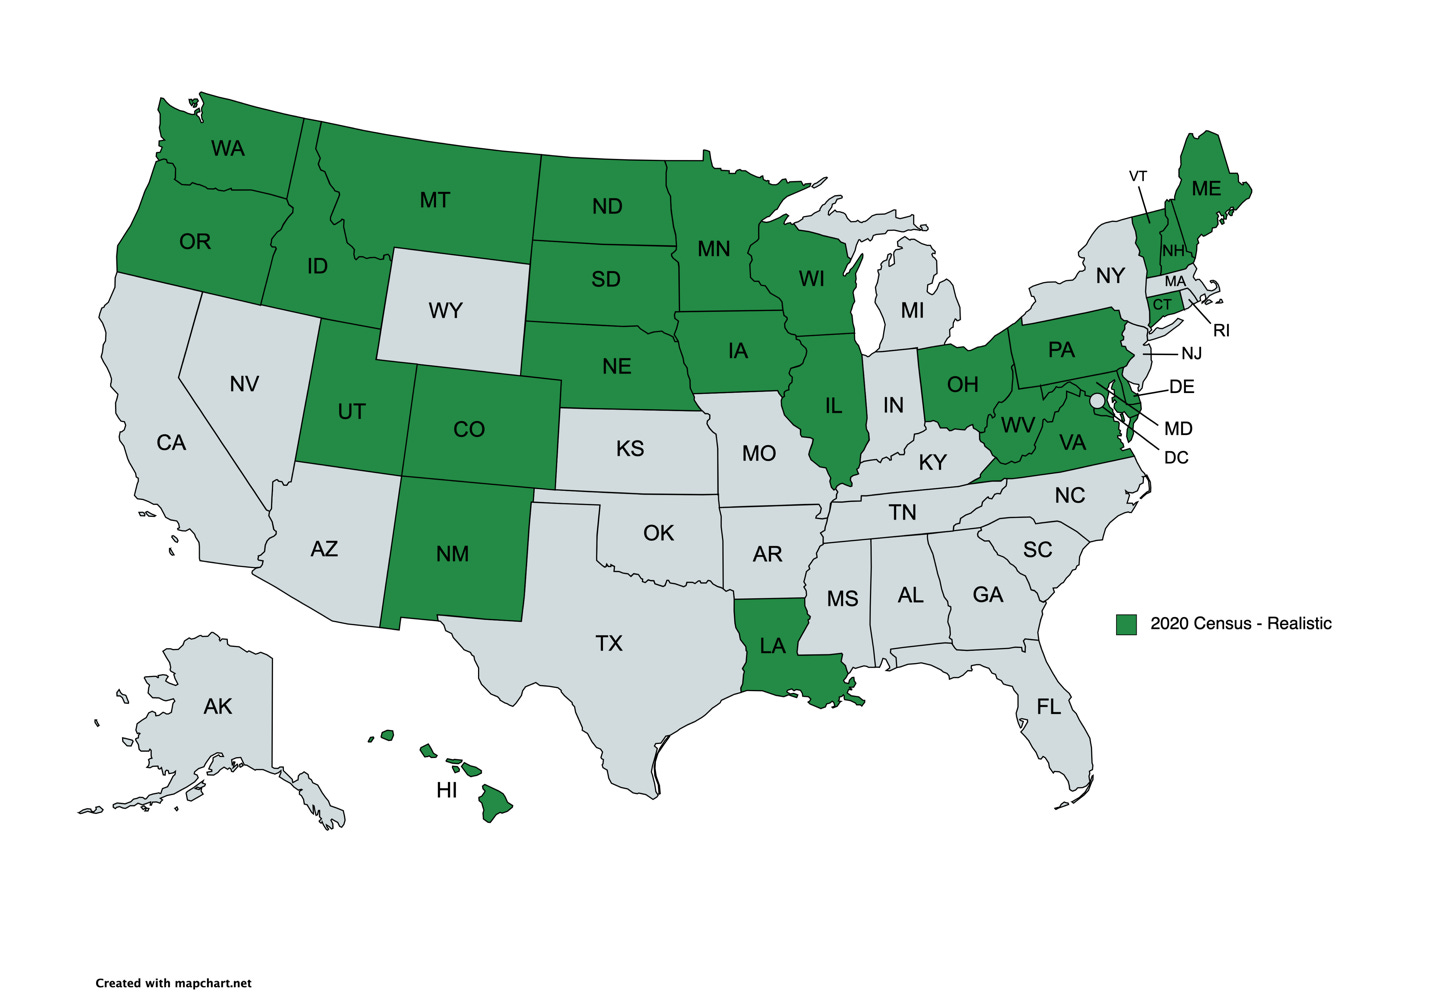
The states pictured above have believable population totals reported in the 2020 census. They are in line with growth trends since the 1980s and reflect migration patterns attached to known regional population loss (such as Californians moving to Oregon or Washington), or economic decline (such as stagnation or population loss seen in Ohio and West Virginia, respectively). These estimates also take into consideration the Census Bureau’s own admission that many states are undercounted or overcounted in the 2020 census.
Note – Certain states experiencing population boom, such as Idaho or Montana, may still have inaccurate totals, but the published totals correlate with known trends to the states, and in many cases, exceed the previous highs. Likewise, states like Pennsylvania reflect believable trend totals, but may still have losses minimized.
-
National Population
The 2020 census reports a total national population of 331,451,309, which is up 22,703,337 from 2010. Starting in the 1980s, decade over decade growth in the previous three decades was 22,166,057, 32,712,046, and 27,324,064, in that order. National growth in the 2010s falls into this spectrum, albeit in the low end.
My working assessment for this experiment is to take the claim of 331,451,309 population at face value and work from there.
-
Remaining States
I split the remaining 24 states and Washington, D.C., into two piles – Red and Blue, to see if state population totals were being manipulated to yield a certain electoral map outcome.
Note – I know President Trump won Michigan; however, it belongs to the necessary Democrat alliance of states for this current political era.
Red
AK, AL, AR, AZ, FL, GA, IN, KS, KY, MO, MS, NC, NV, OK, SC, TN, TX, WY
Blue
CA, DC, MA, MI, NJ, NY, RI
Red State Accounting
I will use Arizona for the example of how the red state model works, since that horse has been beaten to death.
Arizona is clearly exploding in population growth, with much of it from California, but the 2020 census reports the lowest population growth in the state since the 1960s. Population gains in the 1990s were 1,465,404, and 1,261,385 in the 2000s (suppression of population gain was likely occurring a decade ago), making an average two-decade population gain of 1,363,395.
Arizona supposedly only grew by 759,485 in the 2010s, despite California’s collapse and constant expansion in Arizona’s largest metro areas.
1,363,395 average minus 759,485 growth in the 2010s equals 603,910.
603,910 is how short Arizona is from meeting their two-decade average (growth in the 1990s and 2000s) according to the 2020 census.
I am setting these red states to get them to their averages, and not beyond, even though growth is likely at record levels thanks to the sinking California ship next door.
I made the point in my Arizona Senate hearing that either the census data is right, and the vote explosion impossible, or the vote explosion is real, making the census numbers impossible. Either way, there is a serious scandal here.
Here is how short I found other red states to be using this mechanism:
Alaska 56,934
Alabama 125,032
Arkansas 186,983
Florida 194,815
Georgia 580,464
Indiana 168,096
Kansas 103,010
Kentucky 160,567
Missouri 269,941
Mississippi 203,059 (noted by Census bureau as under-represented)
North Carolina 549,668
Nevada 345,296
Oklahoma 95,367
South Carolina 76,270
Tennessee 169,725
Texas 79,582
Wyoming 41,794
This totals 4,010,512 citizens short in these red states, a very conservative estimate that pushes these notably booming states only to their two-decade averages. This number is likely much higher, perhaps up to 6 million.
With 26 states categorized as having “believable” population totals, and a 4,010,512 population shortage discovered in the 17 states above, that leaves 7 states, plus Washington, D.C., that must be bloated by the same amount.
Blue State Accounting
California is the mother ship for all the left’s terrible ideas, and a key cog in controlling the nation and advancing a leftist agenda. It likely has more than five million illegals bloating its overall population, thereby enhancing its electoral representation, and disenfranchising other states. It has begun losing population officially, but likely since at least 2010, not 2020.
Since California is so large, I scraped the other states with a variety of methods, including trend analysis (New York) and averaging (Massachusetts), and arrived at the following overages:
Washington, D.C. (90,411)
Massachusetts (216,686) (noted by Census bureau as over-represented)
Michigan (248,495)
New Jersey (119,556)
New York (421,502) (noted by Census bureau as over-represented)
Rhode Island (40,564) (noted by Census bureau as over-represented)
This leaves California with the balance of 2,873,299 excess population, withheld primarily from states like Arizona, Nevada, and Texas. The northeastern locations are being withheld primarily from North Carolina, South Carolina, Georgia, and Florida.
What Should the Electoral College Look Like?
Here is what the battle for 2024 is shaping up to look like – with Donald Trump’s 2020 hand, certified with all its fraud, totaling 235 electoral votes this time around. Trump’s floor appears to be 176 electoral votes, while any Democrat’s floor is 191.
With 2020 census data normalized, the map takes a dramatic turn for the better for Trump and Republicans in 2024. See below:
Changes
Florida +1
Tennessee +1
Utah +1
Idaho +1
Texas +1
Georgia +1
Arizona +1
Nevada +1
California -5
New York -1
Massachusetts -1
Rhode Island -1
A realistic census cheats Donald Trump out of four guaranteed electoral votes, and four more likely electoral votes (if elections were free and fair), for a total of eight, while Democrats are benefitting unfairly from that same amount. This represents a swing of 16 electoral votes produced one at a time by…you guessed it, more fraud – this time in the construction of the census.
These states were on the borderline for getting an additional elector in my new model:
Alabama (Red)
South Carolina (Red)
Oklahoma (Red)
Arizona (another, Red)
North Carolina (another, Red)
Washington (the only Blue state to arguably be shorted)
Key Takeaways
*The census results are clearly skewed to favor blue states, and the impact is dramatic, swinging guaranteed electoral votes in favor of Democrats by 12, and likely Republican ones (Arizona, Georgia, Nevada, and Texas) by four more, for a total of 16.
*The balance of the U.S. House of Representatives is also upset by this political malfeasance and its disenfranchisement, affording Democrats either a safe path to a majority, or the ability to keep a hypothetical Republican majority at weak levels, as with the composition of the current U.S. House of Representatives.
*Based on dramatic movement to red states in the 1990s, and a slight slowdown reported in the 2000s, it appears manipulation of the electoral count began with the 2010 census, mainly impacting California, Texas, New York, and Florida, our four largest states.
*If it were possible to remove illegal aliens from the census count, and thereby the electoral count, the above findings would be even more dramatic, likely crippling the electoral backing of California, New York, Washington, Illinois, and New Jersey, while only minimally impacting Texas and Florida. The U.S. House would almost certainly always be Republican, and the Electoral College starting point for Republicans being around 200 votes.
*This happened under the noses of We The People for more than a decade, as elections laws and safeguards have been dismantled. We have violated one of the most fundamental of all American core beliefs by trusting our government to deal fairly and honestly in matters of political representation.


Add the Census Bureau to another corrupt governmental organization!
Your founding Fathers knew there would be people aiming to overthrow all legal fairness to the Government structure, hence its complexity. By your research it seems this was in play before Donald was on the scene (2010). What you have uncovered is gobsmacking. You’ve checkmated them with their population stats. Donald upset the path and exposed the rot. Thank God he did. This is a multifaceted takeover by the Democratic Party. Any idle Republican should be viewed as a Democrat sleeper, as this is now all so blatant & frankly impossible to ignore. It goes to show just how much they need to cheat to endeavour to take Donald down and it shows just how much everybody wants him. Thank you Seth for another outstanding article.