Inside the County "S2 File" - Precinct Mapping Project's Actionable 2024 Intel
Topic: Elections
Many of you already know about my ongoing Precinct Mapping Project, which sheds all-new light on the election integrity crisis. That crisis is undoubtedly driven by fraudulent voter registrations that are converted into fraudulent ballots, often mistakenly called “votes,” delivered mainly by ballot harvesters or software, which operates in nearly perfect secrecy.
If we believe, for good reason, there were millions of fraudulent ballots cast in the 2020 election, then those ballots must be contained in states, and if in states, in counties, and if in counties, down to the lowest detectable unit, precincts. Until elections can be properly reformed, if they are to be won, they must be won by enhancing our own pile of votes while diminishing, to the best extent possible, the capacity to cheat. That is why I’ve begun the process of refining my precinct mapping – to produce actionable intelligence (S2, for you military types) to aid in both of those functions in advance of the 2024 quasi-election, which will be one of the filthiest events in human history.
In an October 1 post circulated widely, I asked for sponsors to come forward for the statewide mapping projects, and some have delivered generously. I have the funding to cover all of Florida and New Hampshire, and parts of other critical or large states, like Pennsylvania, Wisconsin, Michigan, Colorado, and Washington. Many donors requested to sponsor their counties, at a much lower cost, and that is the focus of this post.
What follows is what a sponsor or grassroots team can expect when they sponsor a county. For obvious reasons, I will limit how much of this is made public. For those who have already sponsored entire states, in the interest of working hours, I will likely create these S2 Files for the Top 10% of counties.
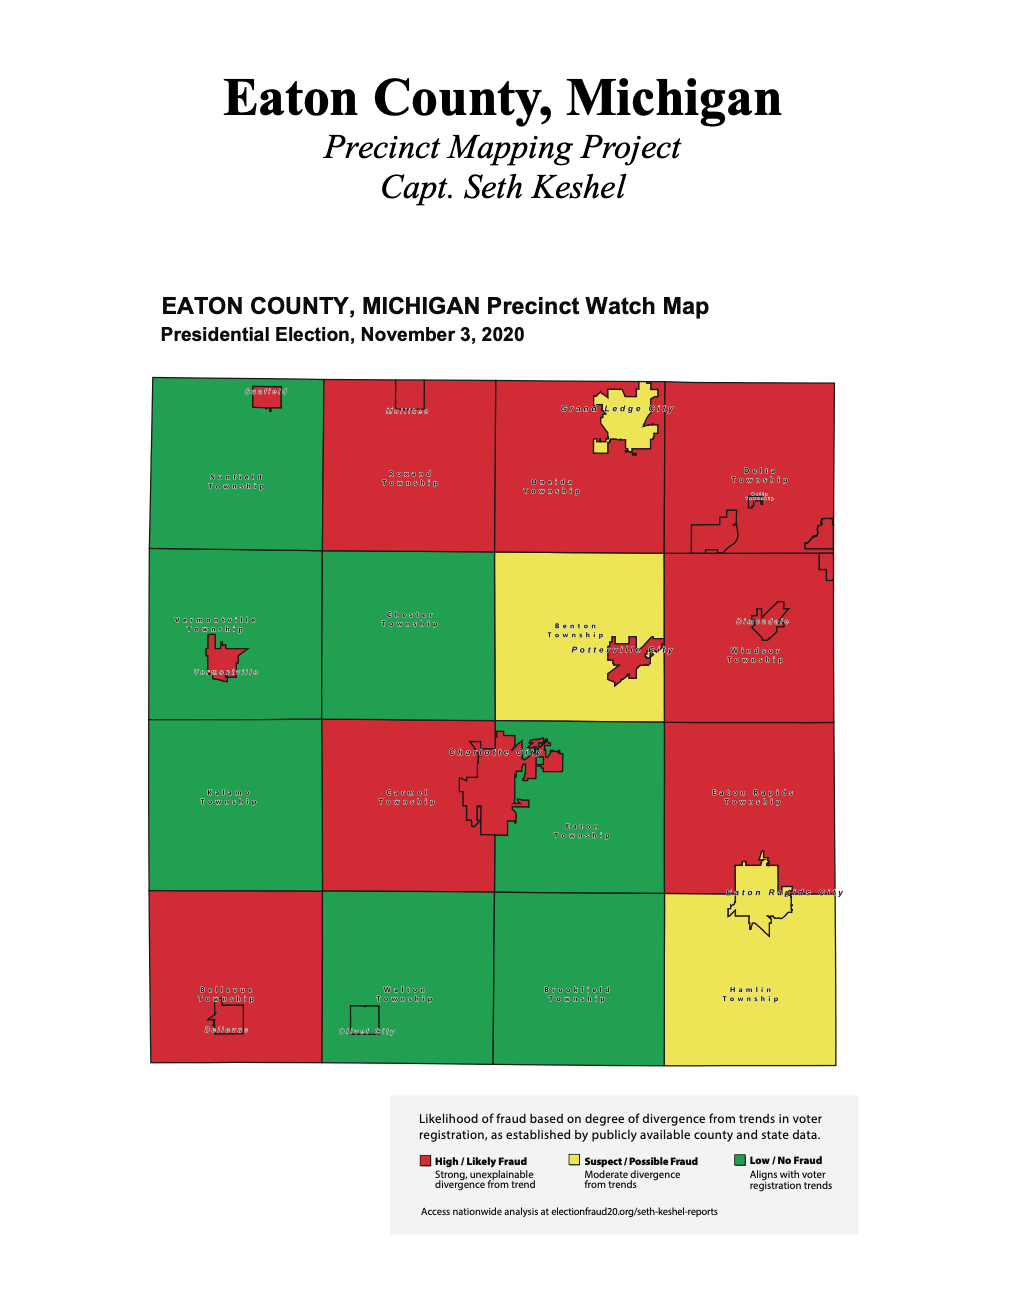
My example is Eaton County, Michigan, which my estimates suggest contains at least 6,799 fictitious Biden votes in a state Donald Trump supposedly lost by less than 155,000 votes:
I have received feedback from several trusted colleagues, and have no fear, Jeff Pedigo’s expertly crafted county map is delivered in PDF format with zoomable functionality – the above is merely a screen grab.
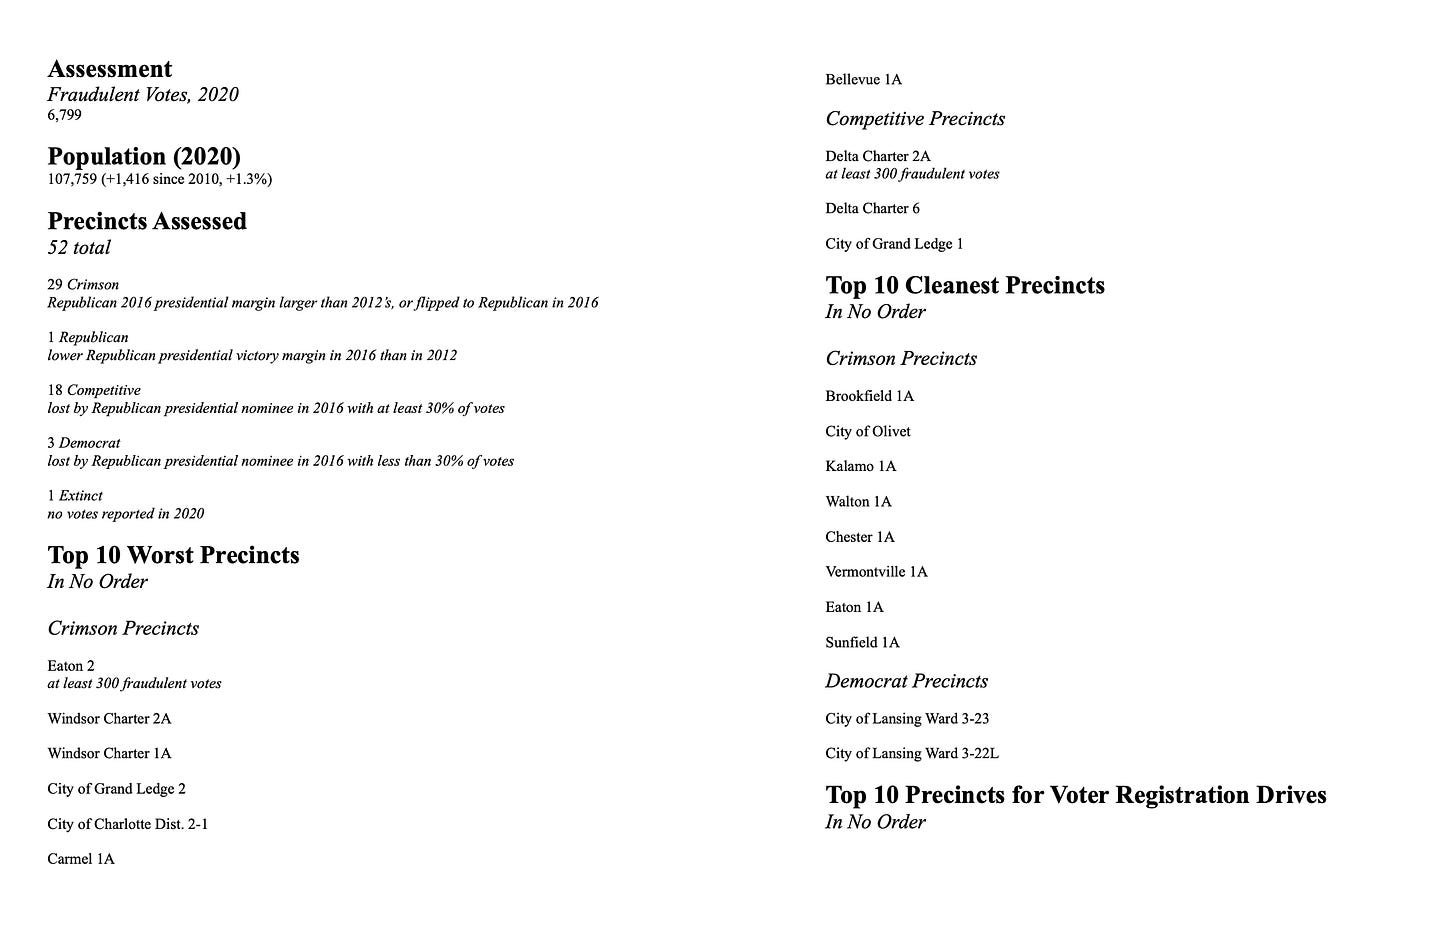
Inside the four-page document, the grassroots team has access to the clearly defined “Top 10 Worst Precincts,” grouped to include the 10 (or fewer, depending on size of county sponsored) precincts in terms of how many fraudulent votes I’ve estimated in them for 2020.
In this example, I have listed Eaton 2 as the most clearly fraudulent precinct in the county, containing at least 300 phony votes. Why?
2012
Romney 316
Obama 267
Total Votes (inc. third party) 599
Romney +8.18%
2016
Trump 361
Clinton 165
Total Votes (inc. third party) 574
Trump +34.15%
Precinct is a Trump Trender (Crimson) in 2016, with Trump’s gains clearly coming from two-time Obama voters. This is Trump’s core base in the Midwest; the expectation is a larger margin for Trump in 2020, especially with a gain greater than or equal to his vote gain of 45 votes in 2016.
2020
Trump 767
Biden 464
Total Votes 1,252
Trump +24.20%
Trump drops nearly 10 points in margin of victory despite having a gain in votes 361 higher than his gain in 2016, which moved the margin of victory nearly 26 points in his favor. Biden clearly has roughly 300 more votes than seems plausible given political trend and incumbent vote gain.
-
I have also included the Top 10 cleanest precincts, in no order, that go against the precinct above in that they display continuing trends like the ones observed from 2012 to 2016, in keeping with their precinct classification. These are likely to have the most accurate voter rolls, given that they do not appear to contain fraudulent votes.
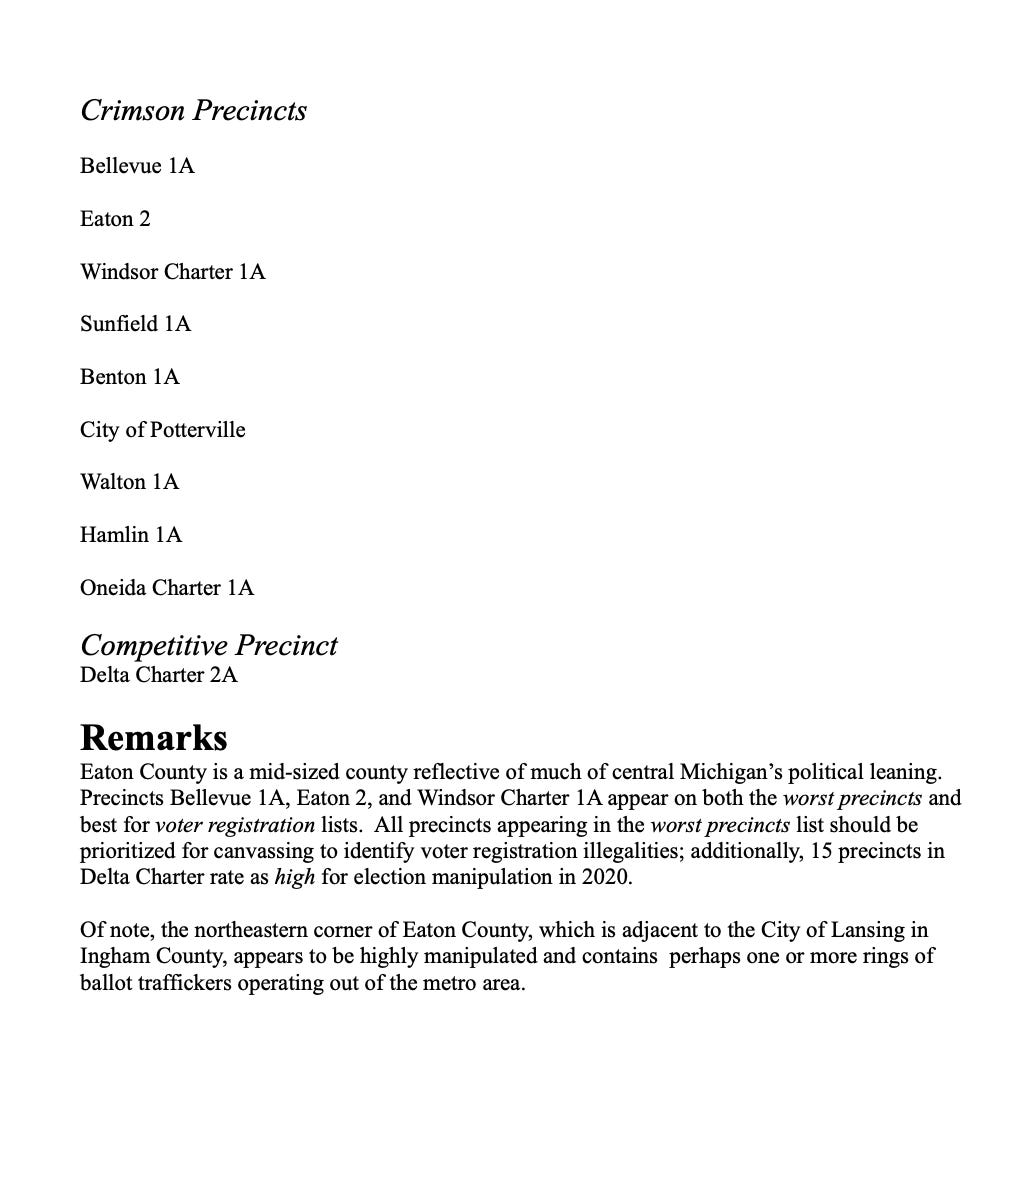
Finally, I include the best precincts for voter registration. These are the ones that had the highest gross increase in Trump votes in 2020, and as such, are likely to be the most fertile fields for amping up vote totals in 2024.
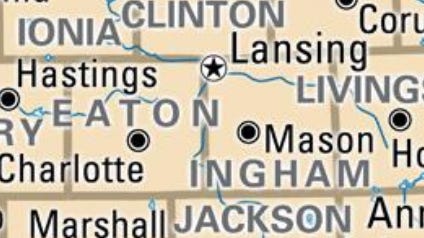
In my final remarks section, a summary contains additional insights. Look what is just east of Eaton County – this is where the picture of the operational environment is clearly painted, just like how I could find that the connecting precincts on Arizona’s reservations are likely contributing to mass ballot harvesting (illegal in Arizona) efforts that dilute the true vote statewide.
Now What?
Please consider sponsoring your county. As sponsor, you and any approved grassroots teams will receive the corresponding “S2 File” for your county. There are likely to be four tiers of counties, with their associated pricing – small, mid-sized, large, and mega counties. This is not an inexpensive project. I am paying my mapper and a researcher who handles the arduous task of compiling all this data in an easily researchable and actionable format for me, and large counties take hours to analyze, a couple days to map, and several hours for me to create the S2 File.
The best option for you as a sponsor is to sponsor these through a contribution to the Election Fairness Institute, of which I am a board member. It is a 501(c)(3) and, as such, your contributions are tax deductible. For larger counties with a higher price tag, this comes in handy.
We have created an email address to handle mapping requests. Please send your county sponsor requests to mapping@goefi.org – and copy me for the time being since the email is new – skeshel@protonmail.com
Thank you very much for your sustained commitment to fixing our country.


What is incredible to me, Captain K, is that your logic in these specific counties comes very very close to predicting the same amount of fraud claimed by Montgomery's p-cap evidence. That's why I'd have you on the quo warranto team. If anyone knows where Pillow Man has placed that evidence, please let me know. For a long time, the FrankSpeech site had an "Elections" tab on top, I think, and it was very easy to find the p-cap numbers for every county in every state. But he's done an overhaul of that site, and set up all sorts of new sites and operations, and I can't seem to get my hands on that data again. Boo.
One thought: given that the narrative pushed by the establishment was that mail-in voting helped increase overall voter participation, my suspicion is that some of the Trump 2020 votes may have also been fraudulent (albeit, not nearly to the extent that the Biden votes were). Deliberately inflate both sides to a designated percentage gap is what the powers-that-be may have been aiming for. Thoughts from Captain K?