North Carolina 2024 Presidential Election Review
Author’s Note: All 2024 Election Reviews can be found here.
Outcome
Trump +3.2% (+183,861)
Trump +5.1% (+281,775)
Preface
While I recognized North Carolina as a battleground state, I never had it on my list of Seven Decisive States because I expected it to go to Trump all along based on the things I track and measure. The Seven Decisive States all required some degree of nuance to peg, but all along, I was adamant that Trump couldn’t allow North Carolina to get Georgia’d. In that sense, North Carolina would have only been decisive had Harris won it, since it would have likely voted right of the other states Trump needed to win. For Trump, North Carolina was not the winning play, but rather an essential cog in his electoral vote pile and the base camp from which he would eventually stack Georgia and Pennsylvania for the requisite majority.
I don’t care how hard the state supposedly is to poll; Trump won it in 2016 and then again in 2020, with one of the worst electoral environments for an incumbent president ever, even though the state was heavily “fortified,” operating without Voter ID, and dealing with mail-in ballots flying around like pigeons on a statue. This time around, 96 out of 100 counties shifted more Republican or less Democrat by registration than they were in 2020, which is more than enough to blot out the gains of Wake and Mecklenburg Counties, which a Democrat nominee must max out to win the state. North Carolinians still have a thing for down ballot Democrats, but only one Democrat presidential nominee since 1976 has won the state, and it was the cherry on top of a national landslide (2008), and even then, only by an eyelash. This preference for Republicans at the federal level will factor heavily in my analysis from this point forward.
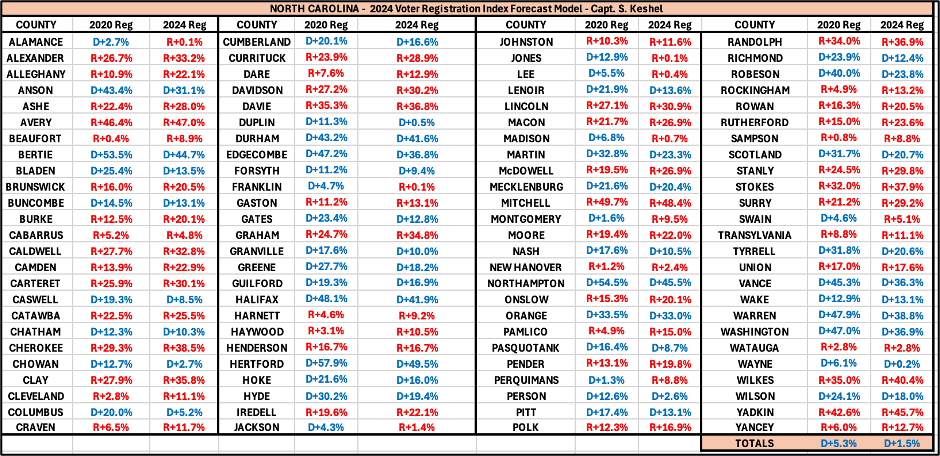
Here is a graphic showing the shifts in voter registration by county in North Carolina, which shifted from D+5.3% in 2020 to just D+1.5% in 2024:
Of the state’s 100 counties, only Cabarrus, Henderson, Mitchell (technicality of roll purge), and Wake Counties moved left in registration, and all by 1.3% or less. With Trump expected to do better with minorities, especially men, and with that constituting roughly a third of the state’s electorate, I felt Trump was likely to win by a comfortable, if not surprisingly high margin. I wound up settling at 5.1%, which may be closer to reality once we peel back the onion on the 2024 race and all down ballot impact, which is where the pain was felt with North Carolina Democrats winning practically everything but the presidency. I never had Biden or Harris likely to carry North Carolina at any point in the 2024 cycle.
Analysis
· Party registration shifts since 2020 (96 counties shifted toward the GOP) suggested Trump would improve in percentage margin those 96 counties. Instead, the party registration indicator went just 83 for 100 in determining shift in percentage margin North Carolina, although eight of those counties are GOP shifting counties Trump won by more votes than he did in 2020. The overall state party registration index shift was accurate in forecasting North Carolina moving right of its 2020 result (Trump +1.3%).
· I accurately predicted Anson (first time since 1972) and Pasquotank (first time since 1988) Counties would flip to Trump.
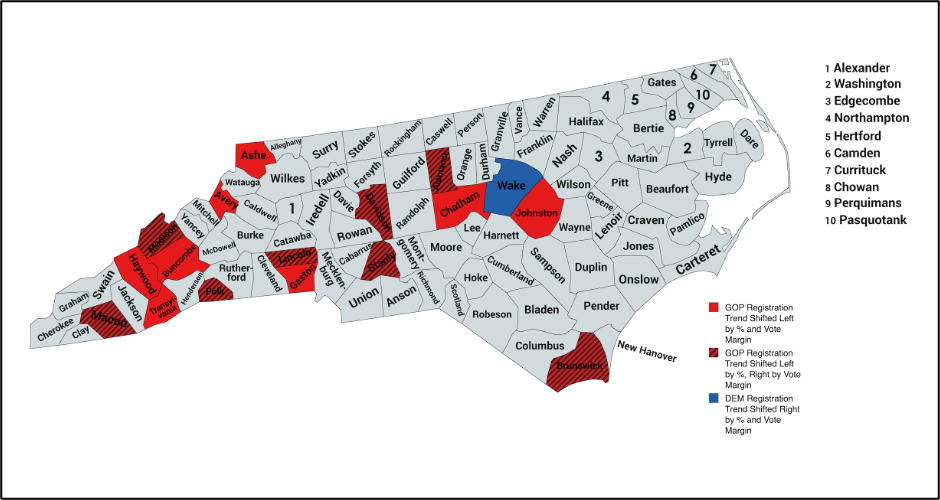
· Here is a map depicting party registration indicator misses:
· Of party registration indicator misses, Trump won Macon, Madison, Polk, Lincoln, Davidson, Stanly, Alamance, and Brunswick Counties by more votes than he did in 2020, but by a smaller percentage than four years ago (the party registration advantage suggested a larger percentage margin). Trump won Haywood, Transylvania, Avery, Ashe, Gaston, and Johnston Counties by a smaller percentage and fewer votes than he did in 2020 despite the party registration indicator suggesting larger margins on both measurements. Trump lost Chatham and Buncombe Counties by more votes and a larger margin than he did in 2020 despite the registration indicator suggesting smaller losses. The only registration indicator miss favoring Trump is Wake County, which gave Harris smaller margins in raw votes and percentage margin than Biden received, despite a slight shift toward Democrats in registration.
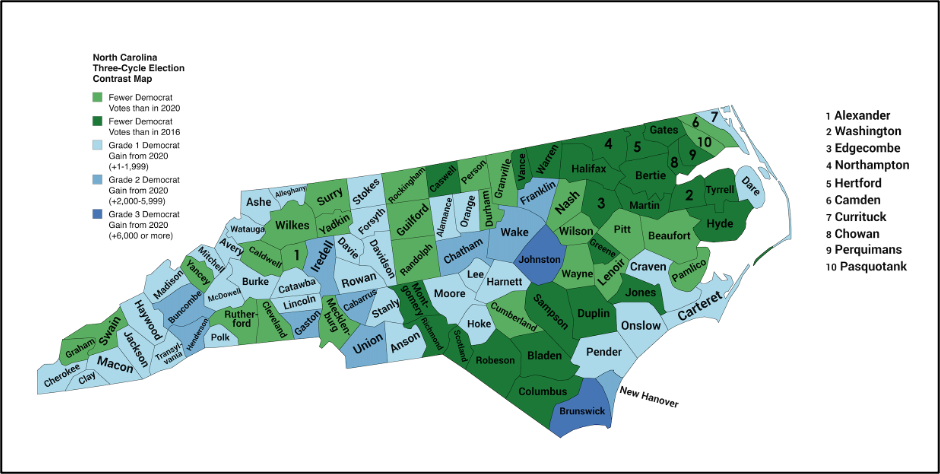
· Referencing the above map, Harris had 31,088 more votes statewide than Biden, and Trump gained 139,653 over his previous performance, for a net shift of 109,378 (1.9%) toward Trump.
· Harris was decimated in Eastern North Carolina and had fewer votes than Hillary Clinton in 25 counties. Most of these demolition jobs occurred in the historically competitive southeast, and in the Black Belt counties in the northeastern portion of the state, signifying Democrat decline with the black demographic. Additionally, Harris had fewer votes than Joe Biden, but more than Clinton, in 26 counties, with most of them in the eastern portion of the state with large black populations, with counties like Nash, Pitt, Cumberland, Wayne, Durham, Guilford, and Mecklenburg most notable in this category.
· Harris’s largest gain in net new votes was in Wake County (+9,648), but with less than a 10% gain, I labeled it as a Grade 2 gain. Brunswick and Johnston Counties had the next highest gains in net new Democrat votes, and with both over 10%, qualify as Grade 3 – or the sharpest Democrat gains in terms of overall severity. Most counties in the “Research Triangle” show modest Democrat gains that hinge largely on population growth from out-of-state.
· Of 29 counties west of the flood disaster line in North Carolina, 11 had percentage margins more favorable to Harris than they were for Biden, despite 10 of them having Republican shifts since 2020. The 10 are:
Ashe – Trump gain of 1.6%, Harris gain of 6.4%
Avery – Trump gain of 0.1%, Harris gain of 1.3%
Buncombe – Trump loss of 5.4%, Harris gain of 2.2%
Gaston – Trump gain of 1.1%, Harris gain of 7.6%
Haywood – Trump gain of 2.5%, Harris gain of 5.9%
Lincoln – Trump gain of 10.6%, Harris gain of 11.8%
Macon – Trump gain of 5.4%, Harris gain of 7.1%
Madison – Trump gain of 3.7%, Harris gain of 3.9%
Polk – Trump gain of 5.4%, Harris gain of 6.8%
Transylvania – Trump loss of 1.2%, Harris gain of 6.3%
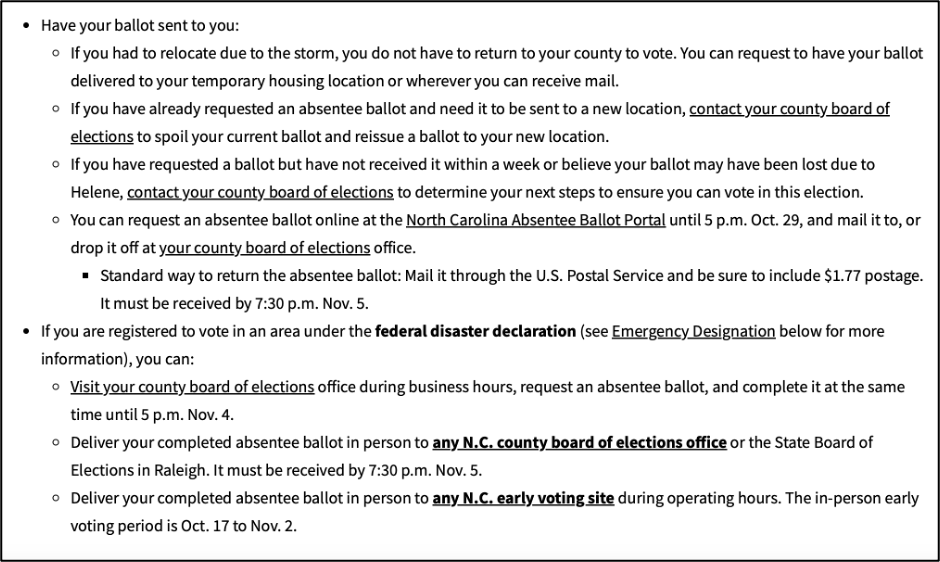
· Keep in mind, Harris’s statewide ballot gain over Biden is less than 1.2%, and except for Buncombe County, the counties bulleted above are some of the toughest for Democrats in the entire state, all moving in a Republican direction by registration, and Harris is widely perceived to have been very poor in responding to the disaster. I suspect the loss in Trump margin, and the failure of the party registration indicator here, is partly owed to lower-than-expected Trump turnout thanks to the disaster effects, but also due to relaxed absentee standards issued after the hurricane that exposed that region to ballot stuffing:
Quality Checks
Keep reading with a 7-day free trial
Subscribe to Captain K's Corner to keep reading this post and get 7 days of free access to the full post archives.


