Pennsylvania 2024 Presidential Election Review
Author’s Note: All 2024 Election Reviews can be found here.
Outcome
Trump +1.7% (+120,266)
Trump +2.8% (+194,333)
Preface
Pennsylvania was clearly the most important battleground of the 2024 election simply because it has the most electoral votes of the bunch – 19. If Trump were to hold his 2020 states, Georgia plus the Keystone State would equal an even 270 electoral votes, making that his quickest path and by default, the quickest punch through any potential effort to throw things off course like when Arizona was abruptly called in 2020.
I had zero doubt Pennsylvania was a Trump state in the making except for one thing – chronic electile dysfunction. As you sift through this report, you will come to understand why Pennsylvania is among the greatest offenders against the cause of free and fair elections, and you may even come to give thanks that Governor Josh Shapiro’s fiat enshrining Automatic Voter Registration wasn’t plunked down sooner than it was.
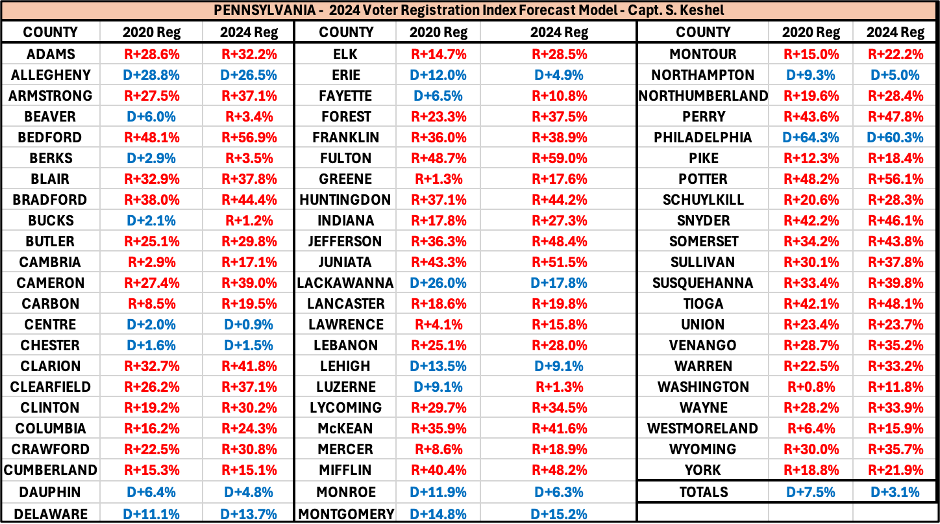
Here is a graphic showing the shifts in voter registration by county in Pennsylvania, which shifted from D+7.5% in 2020 to just D+3.1% in 2024:
Since 2020, just 3 counties – Cumberland, Montgomery, and Delaware – shifted toward Democrats by registration; however, in the immediate run-up to the election, even those counties were showing a GOP shift. 404,727 registrations net shifted toward Republicans in four years, the largest single-cycle shift yet on a trend that began during Barack Obama’s first term in the White House. My call of Pennsylvania (Trump +2.8%), split the difference between my pessimistic analysis (Trump +1.0%) and the registration analysis (Trump +4.6%), and I left it there instead of doubling back toward registrations because I was looking to account for the inevitable, which kept Trump from a convincing win in 2020 in the Commonwealth.
Analysis
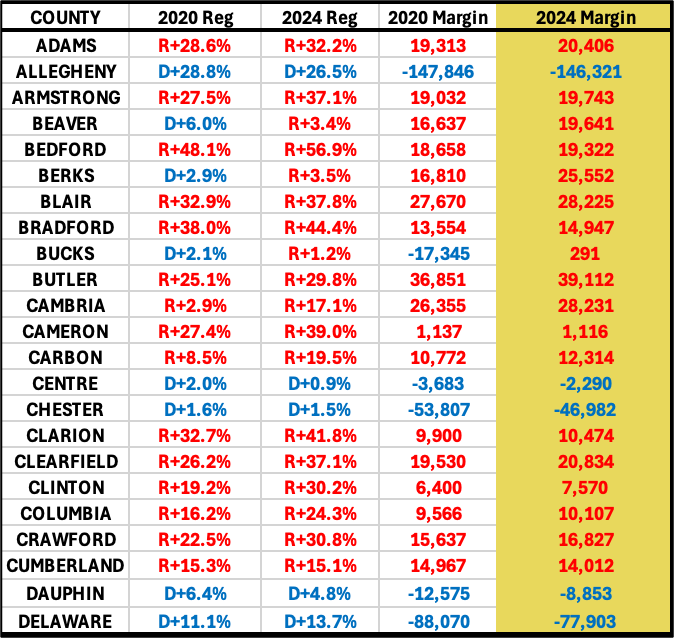
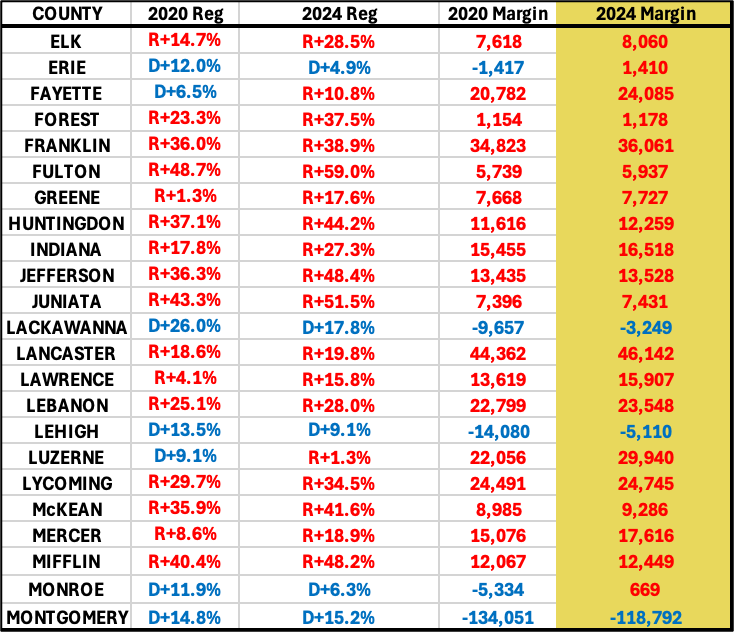
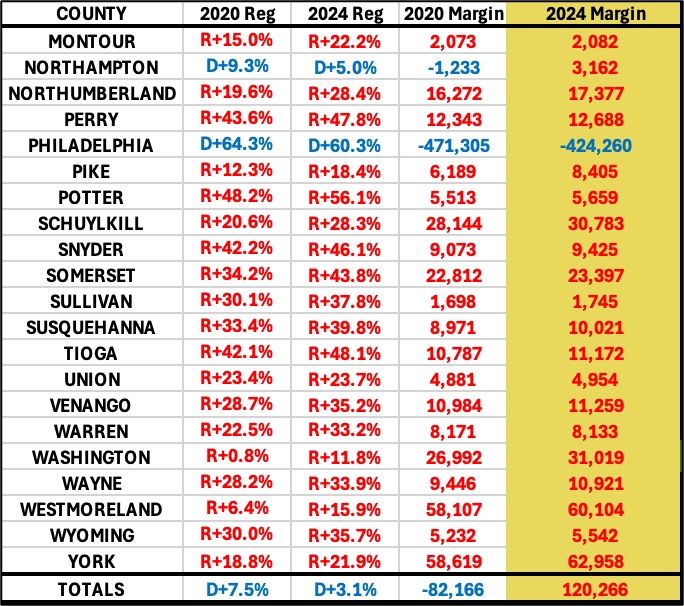
· Party registration shifts since 2020 (64 counties shifted toward the GOP) suggested Trump would improve in 64 of 67 counties. The party registration indicator went just 53 for 67 (79.1%) in Pennsylvania, with margins in 54 counties more favorable for Trump than they were in 2020 by percentage margin. Trump improved by raw vote margin in 64 of 67 counties. 14 of 54 counties shifting more Republican in percentage margin shifted by less than one point, suggesting ballot stuffing occurring and thereby holding back margin progression, particularly in large counties in Westmoreland, Allegheny, Lancaster, and York. Full margin results by county below:
· Cumberland, Montgomery, and Delaware Counties are the only counties that shifted Democrat by registration since the 2020 election. Only Cumberland County shifted Democrat in the vote in keeping with its projected registration forecast, and only by 955 votes in margin (1.1%). Trump’s gains with minorities overrode the slight Democrat shifts present in registration in Philadelphia’s collar counties Montgomery and Delaware. Of the 64 counties with a Republican registration shift, Trump improved by percentage margin in 52, which makes this year’s registration index forecasting tool far less accurate than in the 2016 election, when 60 counties shifted Republican between 2012 and 2016, and 62 counties shifted to the Republican right for Trump. These indicators were also significantly disparate in the highly corrupted 2020 election thanks to the high levels of corruption present.
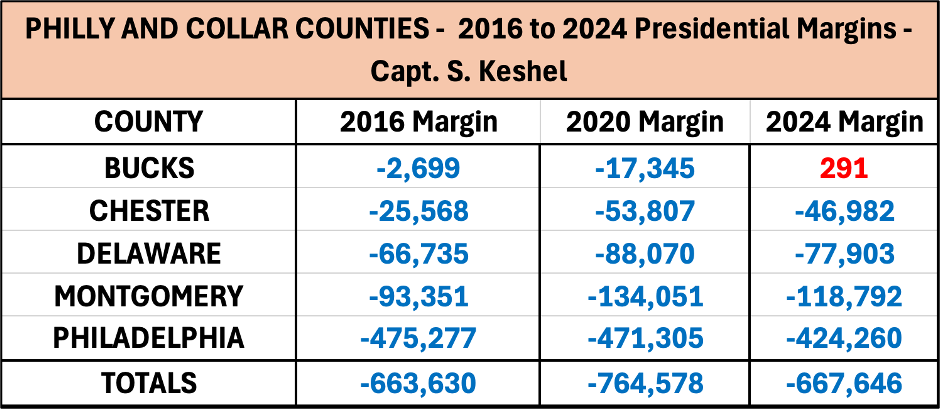
· Trump made substantial gains in Philadelphia and its collar counties, drawing almost exactly even to his 2016 margin of defeat by raw votes in those five counties and flipping Bucks County, despite rampant cheating there that was focused on trying to pull back Bob Casey’s Senate seat:
· I correctly predicted Trump would flip statewide bellwethers Erie and Northampton Counties, along with Monroe and Bucks Counties. I also called for Trump to flip Lackawanna County, but Harris held it by 2.7%.
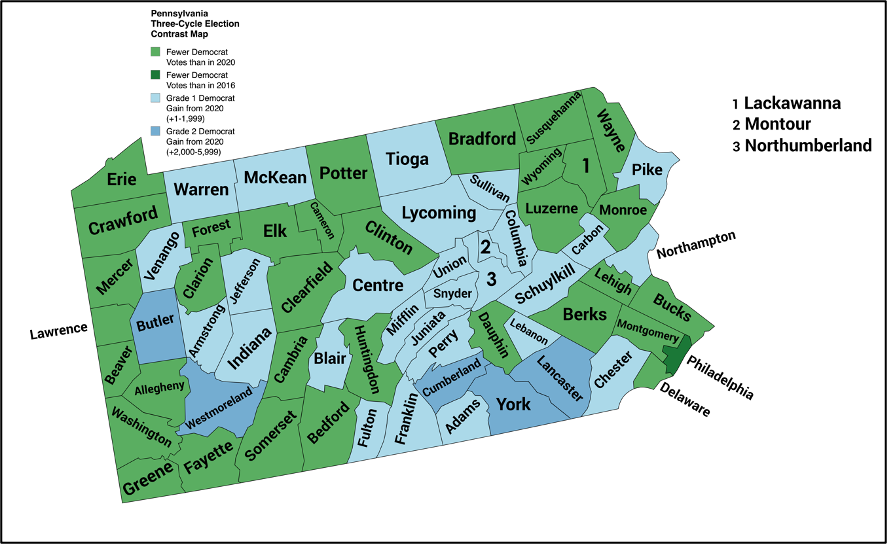
· Harris gained ballots over Biden’s totals in 33 of 67 counties, including gains of more than 2,000 ballots in each of Butler, Westmoreland, Cumberland, York, and Lancaster Counties (qualified as “Grade 2” gains). She lost ballots from Biden’s count in 34 counties, including Philadelphia, where she had the lowest Democrat ballot count since 2004 (John Kerry) - suggesting the cheat was directed elsewhere (perhaps by Josh Shapiro) and lower minority turnout cratered her there. Her gains were contiguous throughout central Pennsylvania and in counties that almost exclusively had heavy GOP registration trends in every Trump cycle. See map below outlining counties with gains and losses:
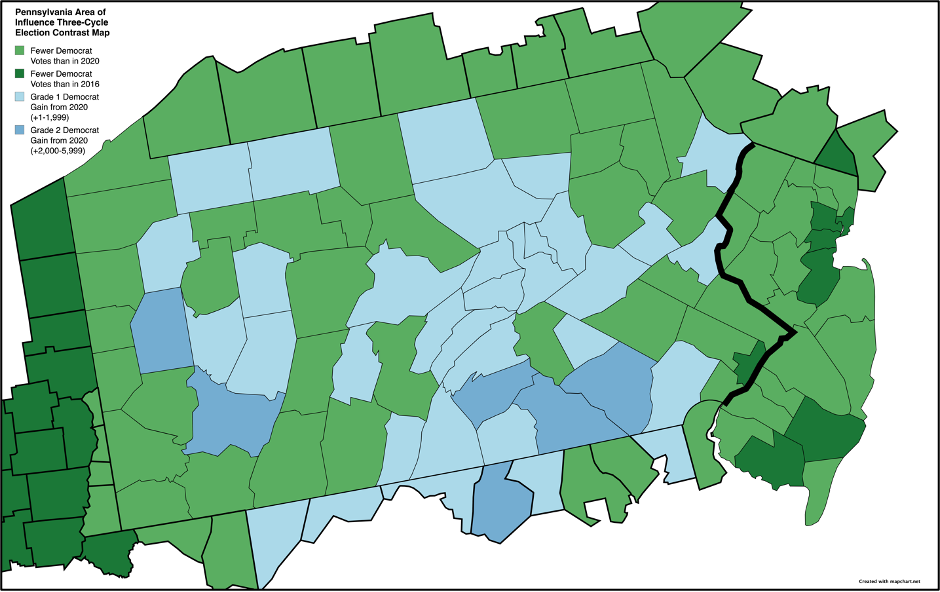
· Now, contrast that map with a map contrasting these counties in Pennsylvania all bordering counties in West Virginia, Maryland, New York, and Delaware, plus a larger adjacent section in Ohio and all of New Jersey:
· I have already made my assessment that there appears to have been no concentrated effort to manipulate ballot counts in any of these states adjacent to Pennsylvania. Without manipulation, it appears almost all of the Keystone State would be headily steadily rightward, especially with Harris failing to gain in any of the selected counties in Ohio, West Virginia, New York, or New Jersey, with minimal gains in Maryland; however, she managed to hold Trump to percentage margin gains in just 52 of 64 counties with a GOP registration shift, and in 14 of them, the shift was less than a single point. Notice how disparate the following numbers in Pennsylvania are compared to surrounding states (excluding Delaware, which has just three counties):
· While 96.8% of all counties in New Jersey, New York, West Virginia, Maryland, and Ohio moved to the Republican right, only 80.6% of counties in Pennsylvania did (despite 95.5% of them suggesting a shift to the right by registration index). Again, 14 of those that did shift Republican were held to a shift of less than a point right. The three most suspicious in that category are York, Lancaster, and Westmoreland Counties. As for the smaller counties throughout the heart of Pennsylvania, it is important to understand their role in providing large enough GOP margins to blot out the massive losses in Philadelphia and its collar counties shown above. Here is how the “Philly Five” track with the rest of the state in all three Trump races (Trump’s gains in eastern Pennsylvania proved critical):
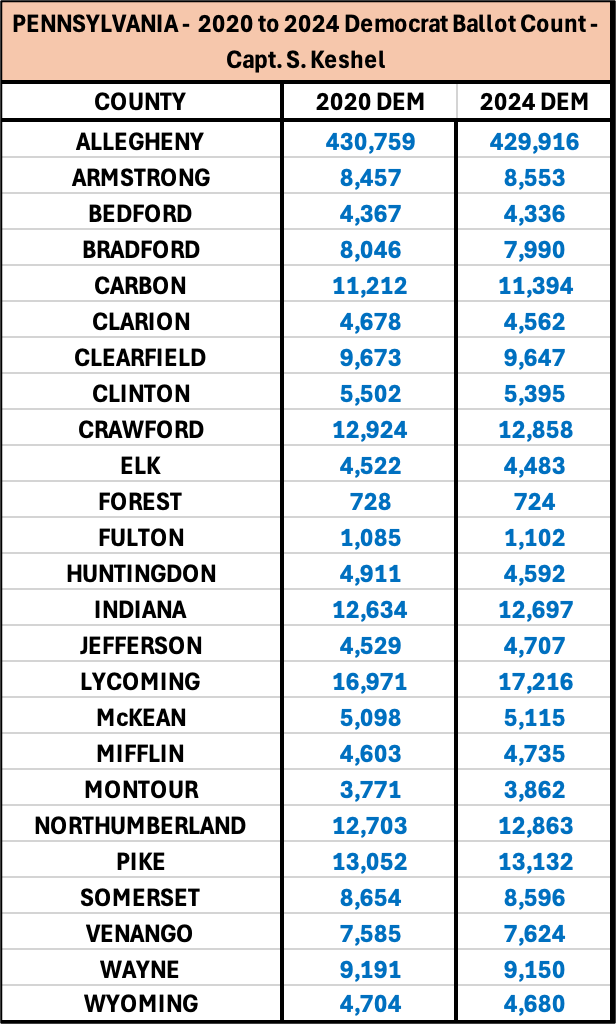
· I have highlighted Westmoreland County specifically for its ludicrous 2020 election results, which have carried forward into 2024 despite a complete collapse of the Democrat Party in the county and region, and subsequent realignment under the Republican banner in these largely depopulating counties. It is obvious to me, after reviewing two Pennsylvania elections with no-excuse mail-in balloting and with the state now operating Automatic Voter Registration, that ballot collection rings scrape the same names (whether real or fictitious) for ballots every cycle. Here is a selection of 25 counties, all small except for Allegheny County – notice how nearly identical Biden and Harris’ ballot counts are, four years apart and with Trump flipping the state:
· Similarly configured working-class counties in Ohio, West Virginia, New York, and New Jersey saw starkly different results with margin shifts and Democrat collapses. In Allegheny County (Pittsburgh), Harris lost just 0.2% of Joe Biden’s ballot count and had a margin of victory over Trump just 1,525 lower than Biden’s. Here is how Harris performed in other industrial metro areas throughout the region:
o Erie County, NY loss of 18,169 (-7.0%)
o Cuyahoga County, OH loss of 39,792 (-9.6%) – lowest Democrat ballot count since 2000
o Lucas County, OH loss of 9,091 (-7.9%) – lowest Democrat ballot count since 1996
o Mahoning County, OH loss of 7,005 (-12.2%) – lowest Democrat ballot count since 1932
o Marion County, IN loss of 26,053 (-10.5%)
o Lake County, IN loss of 15,784 (-12.6%) – lowest Democrat ballot count since 2000
o Cook County, IL loss of 278,152 (-16.1%) – lowest Democrat ballot count since 2004
Allegheny County likely has at least 30,000 fraudulent ballots for Harris alone, assessing Erie County’s (New York) 7.0% decline only.
Quality Checks
Statewide Presidential Ballot Count
Keep reading with a 7-day free trial
Subscribe to Captain K's Corner to keep reading this post and get 7 days of free access to the full post archives.


