Pennsylvania - Trump v. Harris Voter Registration Index Forecast Model
Topic: 2024 Election Forecast
Voter Registration by Party is the most accurate of all indicators in assessing the trajectory of upcoming presidential elections in a county or state. The logic goes like this: if a young black man registers to vote as a Democrat in Philadelphia in August 2008, who do you think he is voting for? If a white, non-college factory worker from Johnstown, Pennsylvania, switches from Democrat to Republican in September 2016, who do you think he is voting for? If you chose Barack Obama and Donald Trump, respectively, your thinking is correct.
Critics of this theory like to say, “you don’t have to vote Republican just because you’re a Republican,” and to some extent, that is correct. It takes a little discernment to understand each county and its intricacies. Please read my pieces on Westmoreland County, Pennsylvania, and last week’s introduction to the 2024 Voter Registration Index Forecast Model, featuring Pinal County, Arizona.
Pennsylvania’s pessimistic trend model was finished last month and shows Donald Trump with a likely 1.0% winning margin in that scenario. This piece focuses on likely outcomes based on registration analysis by county using Trump’s own registration to results coefficient, and soon, in a final piece just before the election, I will issue a formal projection blending all analytical disciplines, including using more registration data where necessary.
Pennsylvania Voter Registration by Party
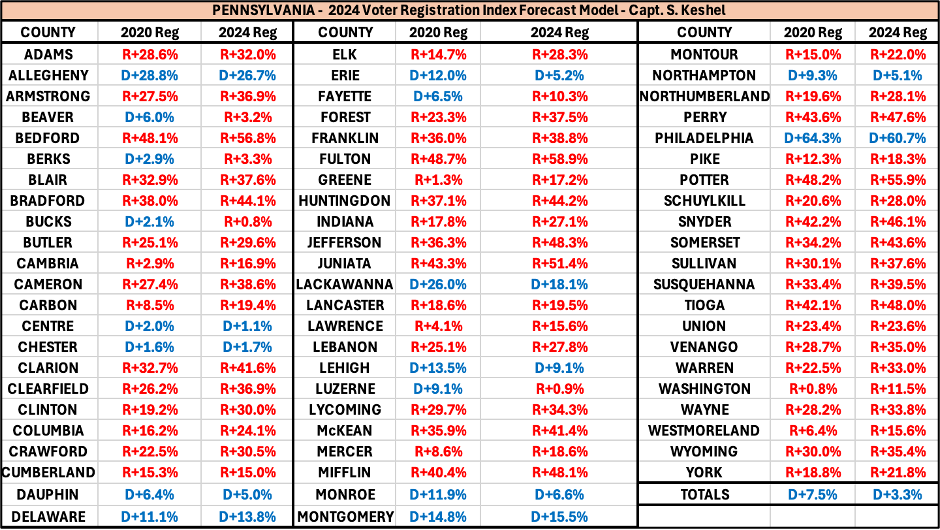
First, here is the shift in Voter Registration by Party since the 2020 quasi-election in Pennsylvania:
Pennsylvania, which unfortunately adopted Automatic Voter Registration last September, releases new voter registration by party statistics every Monday without fail. In a whopping but familiar sequence, 63 of 67 counties are either more Republican in party registration than they were in 2020, or less Democrat. The four that aren’t moving right are Cumberland, Montgomery, Chester, and Delaware Counties, and the latter three in that grouping are all collar counties of Philadelphia that were once reliably Republican (the non-MAGA strain). To put this into its mind-boggling glory, the Democrat registration lead has evaporated from 1,236,467 (D+14.2%) for Obama’s 2008 landslide (the biggest presidential win in Pennsylvania since Lyndon Johnson’s 1964 national landslide) to a mere 297,824 (D+3.3%) today. Party switchers are now coming in at a nearly 3 to 1 Republican rate.
Analysis
In this piece, I am showing you what the results are likely to be at the state level given the shifting of voter registration by party and Donald Trump’s two known performances relative to the registration indexes.
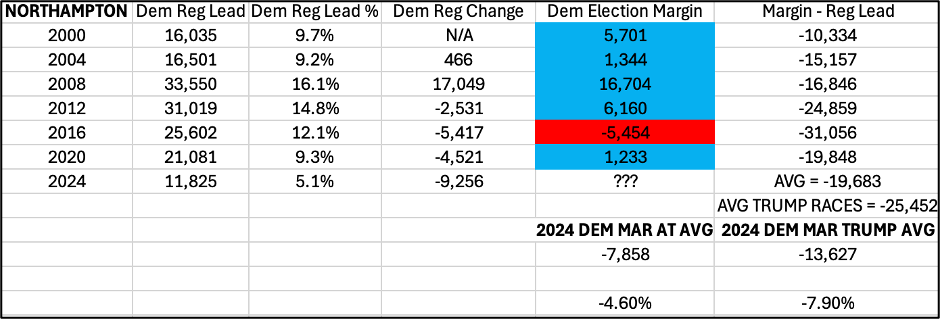
Here is Northampton County, the working-class bellwether in Eastern Pennsylvania, for example:
Luzerne County used to be the presidential bellwether in Pennsylvania. It had aligned itself with the winner of Pennsylvania’s electoral votes in every election from 1936 through 2016, a streak that terminated with the “safest and most secure election of all-time” in 2020. That county is now a Republican-plurality registration county, so the Democrat election mafia has moved the goalposts to say Northampton and Erie Counties are the new bellwethers.
Keep reading with a 7-day free trial
Subscribe to Captain K's Corner to keep reading this post and get 7 days of free access to the full post archives.


