Arizona - Trump v. Harris Voter Registration Index Forecast Model
Topic: 2024 Election Forecast
Background
Voter Registration by Party is the most accurate of all indicators in assessing the trajectory of upcoming presidential elections in a county or state. The logic goes like this: if a young black man registers to vote as a Democrat in Philadelphia in August 2008, who do you think he is voting for? If a white, non-college factory worker from Johnstown, Pennsylvania, switches from Democrat to Republican in September 2016, who do you think he is voting for? If you chose Barack Obama and Donald Trump, respectively, your thinking is correct.
Critics of this theory like to say, “you don’t have to vote Republican just because you’re a Republican,” and to some extent, that is correct. It takes a little discernment to understand each county and its intricacies. Please read my pieces on Westmoreland County, Pennsylvania, and last week’s introduction to the 2024 Voter Registration Index Forecast Model, featuring Pinal County, Arizona.
Arizona’s pessimistic trend model is already done and shows Donald Trump with a likely 1.4% winning margin in that scenario. This piece focuses on likely outcomes based on registration analysis by county using Trump’s own registration to results coefficient, and soon, in a final piece just before the election, I will issue a formal projection blending all analytical disciplines, including using more registration data where necessary.
Arizona Voter Registration by Party
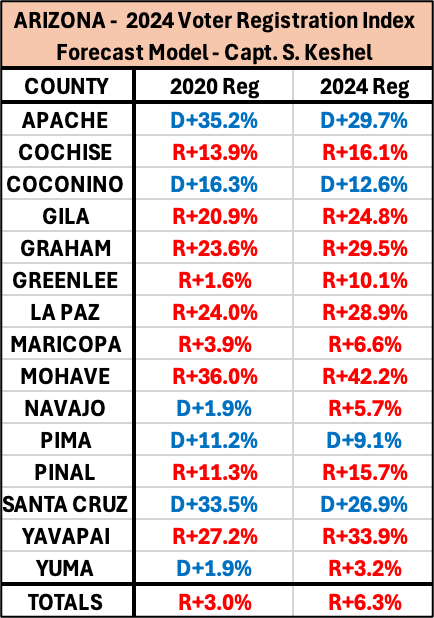
First, here is the shift in Voter Registration by Party since the 2020 quasi-election in Arizona:
I have adjusted the above graphic from the July Secretary of State statewide release by adding in known values from Maricopa, Pima, and Yavapai Counties, which I receive and log frequent updates from. You will see that all 15 counties are either more Republican in party registration than they were in 2020, or less Democrat. Two counties, both of which ironically have a long history of voting Republican in federal elections, Navajo and Yuma, formally flipped to GOP registration advantage largely on the strength of Latino and Native American party switchers. No shift is more enormous than that observed in Maricopa County, which casts more than 60% of the state’s vote; it has moved from a Republican +100,884 advantage four years ago to +166,732 at the time of my update last night, stated as having moved from R+3.9% (3.9% more Republicans registered than Democrats) to R+6.6%, and still growing.
Analysis
When some polling company or angry media outlet picks up this article and scoffs at it, they should know that I’m simply relaying data that has absolutely no opinion attached to it. This part is the most hands-free part, whereas my pessimistic analysis took some proprietary effort, and my final, blended prediction will include some gut calls and updates to this article with the final voter registration figures that will be published ahead of Election Day.
In this piece, I am showing you what the results are likely to be given the shifting of voter registration by party and Donald Trump’s two known performances relative to the registration indexes.
Here is Graham County, the Republican stronghold in Eastern Arizona, for example.
Trump won Graham County by +4,724 in margin in 2016, when the GOP had a registration at advantage of +2,512 (R+14.1%). His margin was 2,212 to the right of the registration index, which had been rapidly reddening from an ancestral, working-class Democrat registration index at the turn of the century. In 2020, despite election “fortification,” he won by +6,715, running 2,034 to the right of a +4,681-registration advantage.
That average comes out to 2,123 to the right of the registration advantage. Right now, the Republicans have a +5,752 registration advantage (R+29.5%) in Graham County, which will likely clear 6,000 by Election Day. Trump’s +2,123 coefficient average plus the registration advantage of +5,752 leads me to conclude Trump’s likely margin in this model is +7,875 (+52.5%) in Graham County, which would up his margin by +1,160 from 2020.
Here is how the entire 15-county field shakes out, calculated the same way:
Keep reading with a 7-day free trial
Subscribe to Captain K's Corner to keep reading this post and get 7 days of free access to the full post archives.


