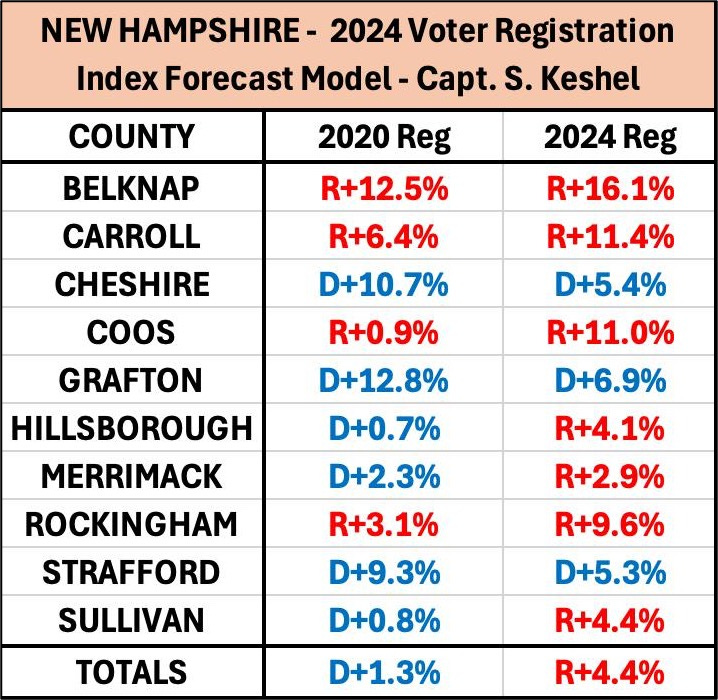
New Hampshire - Trump v. Harris Voter Registration Index Forecast Model
Topic: 2024 Election Forecast
A lead-in on Voter Registration by Party analysis, from my Voter Registration Index Forecast Model preview of Arizona:
Voter Registration by Party is the most accurate of all indicators in assessing the trajectory of upcoming presidential elections in a county or state. The logic goes like this: if a young black man registers to vote as a Democrat in Philadelphia in August 2008, who do you think he is voting for? If a white, non-college factory worker from Johnstown, Pennsylvania, switches from Democrat to Republican in September 2016, who do you think he is voting for? If you chose Barack Obama and Donald Trump, respectively, your thinking is correct.
Critics of this theory like to say, “you don’t have to vote Republican just because you’re a Republican,” and to some extent, that is correct. It takes a little discernment to understand each county and its intricacies. Please read my pieces on Westmoreland County, Pennsylvania, and last week’s introduction to the 2024 Voter Registration Index Forecast Model, featuring Pinal County, Arizona.
My pessimistic outlook for New Hampshire shows little variance from the bloated 2020 outcome, primarily because partisanship is less of a factor than independent behavior there is, making it difficult to peg obvious trends like the ones that can be found throughout the Industrial Midwest. If that outlook came to fruition, it would result in a Harris win just shy of seven points.
Trump’s performance in Rockingham and Hillsborough Counties, the two counties in the state’s southeast nearest and most influenced by Boston, which made up 53.5% of the 2020 ballot count, will be the deciding factor of whether the Granite State aligns with polling and the 2020 outcome, or comes down to the wire. The outlying counties have far less margin up for grabs and are populated by some unique voting groups – including rural liberals who like guns and want to be left alone, and old school stodgy conservatives who don’t like Trump’s tone. In this sense, New Hampshire is one of the hardest states on the map to pin down on voter behavior and expected outcomes, with some areas very Trumpy, and others completely opposed to the MAGA agenda and aligned with the New England brand of leftism.
This piece focuses on likely outcomes based on registration analysis by county using Trump’s own registration to results coefficient, and soon, in a final piece just before the election, I will issue a formal projection blending all analytical disciplines, including using more registration data where necessary.
New Hampshire Voter Registration by Party
First, here is the shift in Voter Registration by Party since the 2020 quasi-election in New Hampshire:
The good news for Trump here is twofold. First, the state is shifted 5.7% toward Republicans since the 2020 race, which featured a Democrat voter registration advantage in a presidential election for the first time ever. Second, since New Hampshire does not operate Automatic Voter Registration, the rolls have not bloated and, in fact, have been purged by more than 200,000 since four years ago.
Take note, however, that New Hampshire had many Democrats register as Republicans to attempt (and fail) to throw the state’s Republican delegates to Nikki Haley in their GOP primary. It appears, with a slight shift left since June, that the rolls are adjusting back to normal. As I will demonstrate in the balance of this article, New Hampshire always votes to the left of its registration advantage, whether a Republican or Democrat advantage, and it appears the state is on its way to being surprisingly close and in direct defiance of most polling that shows a comfortable Harris lead at or near Biden’s “fortified” 2020 margin.
Analysis
From the original Arizona registration forecast:
When some polling outfit or angry media outlet picks up this article and scoffs at it, they should know that I’m simply relaying data that has absolutely no opinion attached to it. This part is the most hands-free part, whereas my pessimistic analysis took some proprietary effort, and my final, blended prediction will include some gut calls and updates to this article with the final voter registration figures that will be published ahead of Election Day.
In this piece, I am showing you what the results are likely to be given the shifting of voter registration by party and Donald Trump’s two known performances relative to the registration indexes.
Here is my model for Belknap County, a Republican stronghold in central New Hampshire:
Belknap has backed all but one GOP presidential nominee since 1968 (skipping over McCain in 2008) and is one of just two counties in the state certified as a Trump win in 2020. Trump has finished 1,071 and 2,679 left of the GOP registration advantage in his two races, and this is common throughout the state, as only one county (Coos) votes to the right of the registration advantage in the Trump era. The Democrat registrations in the county have cratered, leaving Belknap with a R+16.1% (+8,578) registration advantage, giving Trump the county by +6,703 votes if he sticks to his average (a win of roughly 17.4%). This would enhance his margin by 2,698 over 2020.
Here is how the entire 10-county field shakes out, calculated the same way:
Keep reading with a 7-day free trial
Subscribe to Captain K's Corner to keep reading this post and get 7 days of free access to the full post archives.


