Measurements represents a science discipline in and of itself. As someone who has dealt with statistics and/or pattern recognition for years, starting in baseball, then in the military in a combat environment, and later in elections, I’ve heard it a million times – “90 percent of statistics are made up.”
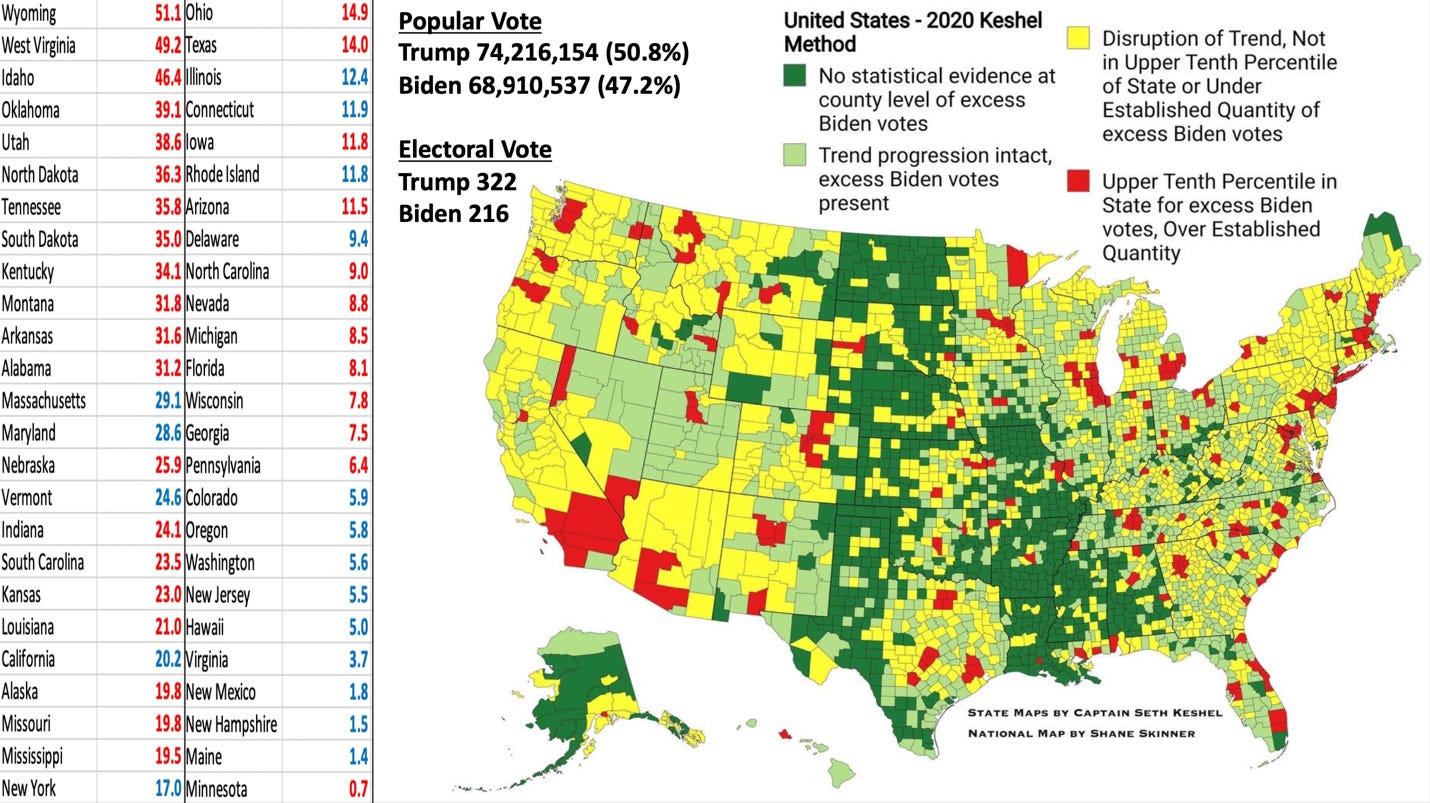
I have made many assessments of the 2020 presidential quasi-election. My baseline assessment is reflected in this graphic:
My assessment of the 3,143 county equivalents at the county level (the estimate made from viewing the total of votes prior to scrutinizing precinct data) suggests an Electoral College victory of 322-216 for Trump in an election free of the corrupt practices that ushered in the 46th President, with a popular vote victory of 5.3 million in margin (3.5%). That breaks down into many valuable metrics:
Most Fraudulent Votes:
California - 1,959,634
Most Fraudulent Margin:
Hawaii – 24.5% inflated
Most Fraudulent Votes per Elector:
Washington – 49,176 (590,112 fraudulent ballots divided by 12 electors)
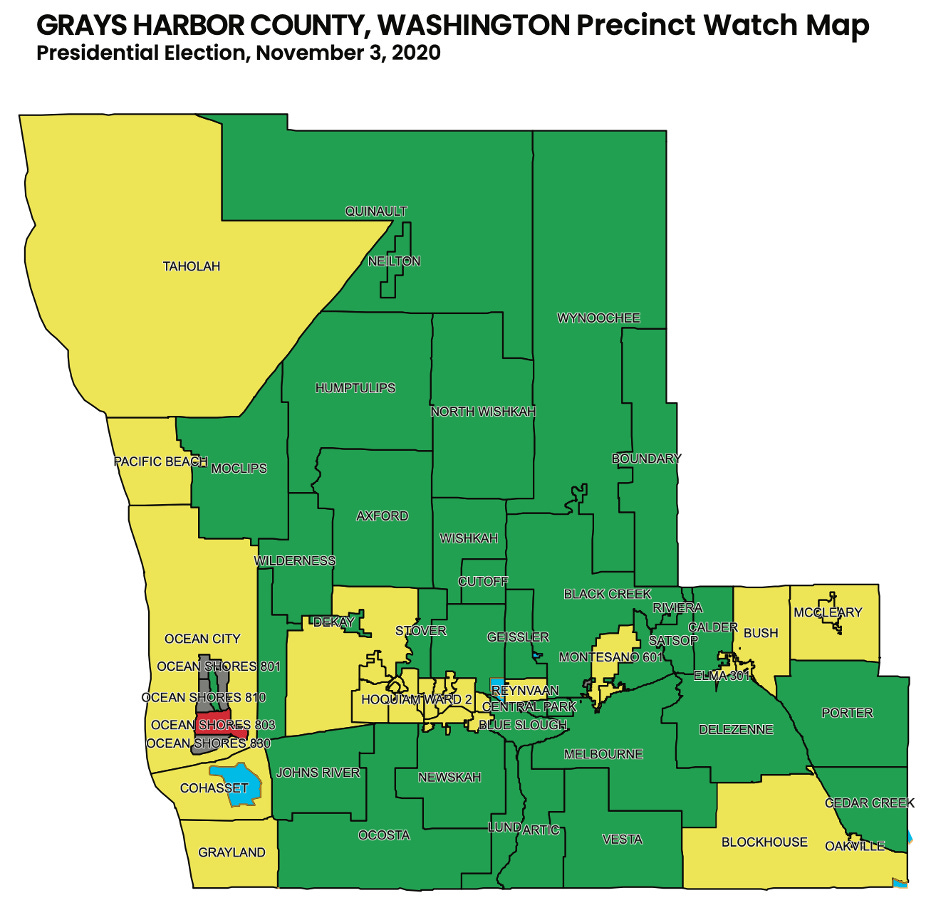
Those three states come as no surprise to anyone watching the electoral situation with eagle eyes. While Washington State is clearly choked out by every method of electioneering known to mankind – mail-balloting, ballot harvesting, Automatic Voter Registration, and the assorted use of technology to adjudicate, tabulate, and otherwise process ballots – the state is organized into so many precincts it is easy to spread out excess ballots. For instance, in Grays Harbor County – a county won by Donald Trump in 2016 and 2020 for the first GOP presidential wins since 1928 – I estimated 7,354 likely fictitious ballots for Joe Biden, which made his losing effort there much closer and in line with a statewide blowout rather than in line with what I believe would have been a race within six points for the presidency and down to the wire for the governorship. However, the map for Grays Harbor looks like this:
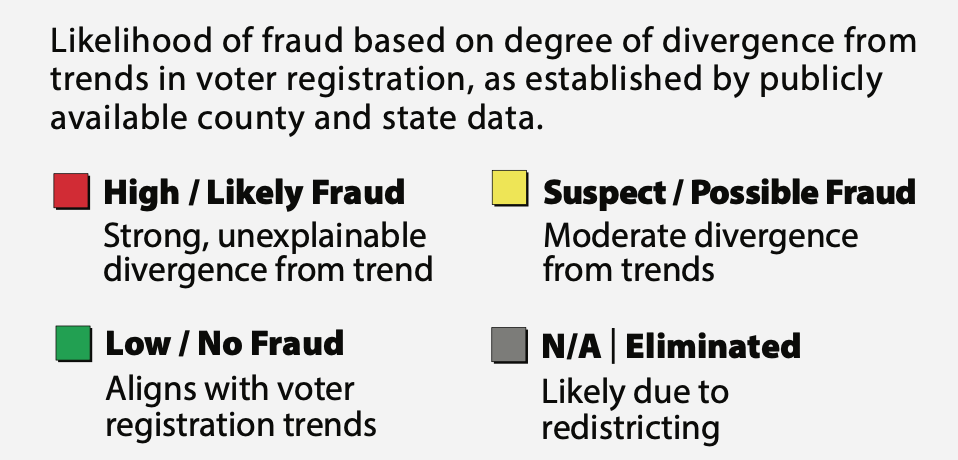
I identified just one precinct – located in Ocean Shores – that rates as high based on my proprietary model predicting the likely number of fraudulently produced ballots. The rest of the precincts feature a smattering of likely excess indications that do not reach my threshold for being colored in red (high). While the county, and therefore the state, totals suggest overwhelming bloating of the vote for the home team (the Democrat Party), it is harder to locate it on paper than it is in a state that divides its counties into fewer precincts, such as Georgia…
Or New Jersey.
I wrote a few months ago about President Trump’s stated goal to challenge Joe Biden for New Jersey’s 14 electoral votes, which if successful would make Trump the first GOP nominee to carry the Garden State since 1988. This cause has led to increased interest from election warriors in the state, which not only generated an event I spoke at in February in Somerset County, but a full sponsorship of all 21 counties in the state for the Precinct Mapping Project. New Jersey’s counties are inconsistent with how they furnish presidential election data, so my analysis has focused at the municipality level (townships and boros) rather than true precincts; while it is less laser-accurate in terms of geography, it is very useful in figuring out exactly which proverbial kid pissed in the pool.
Before I dig too deeply, allow me to present a brief narrative of New Jersey’s recent electoral history:
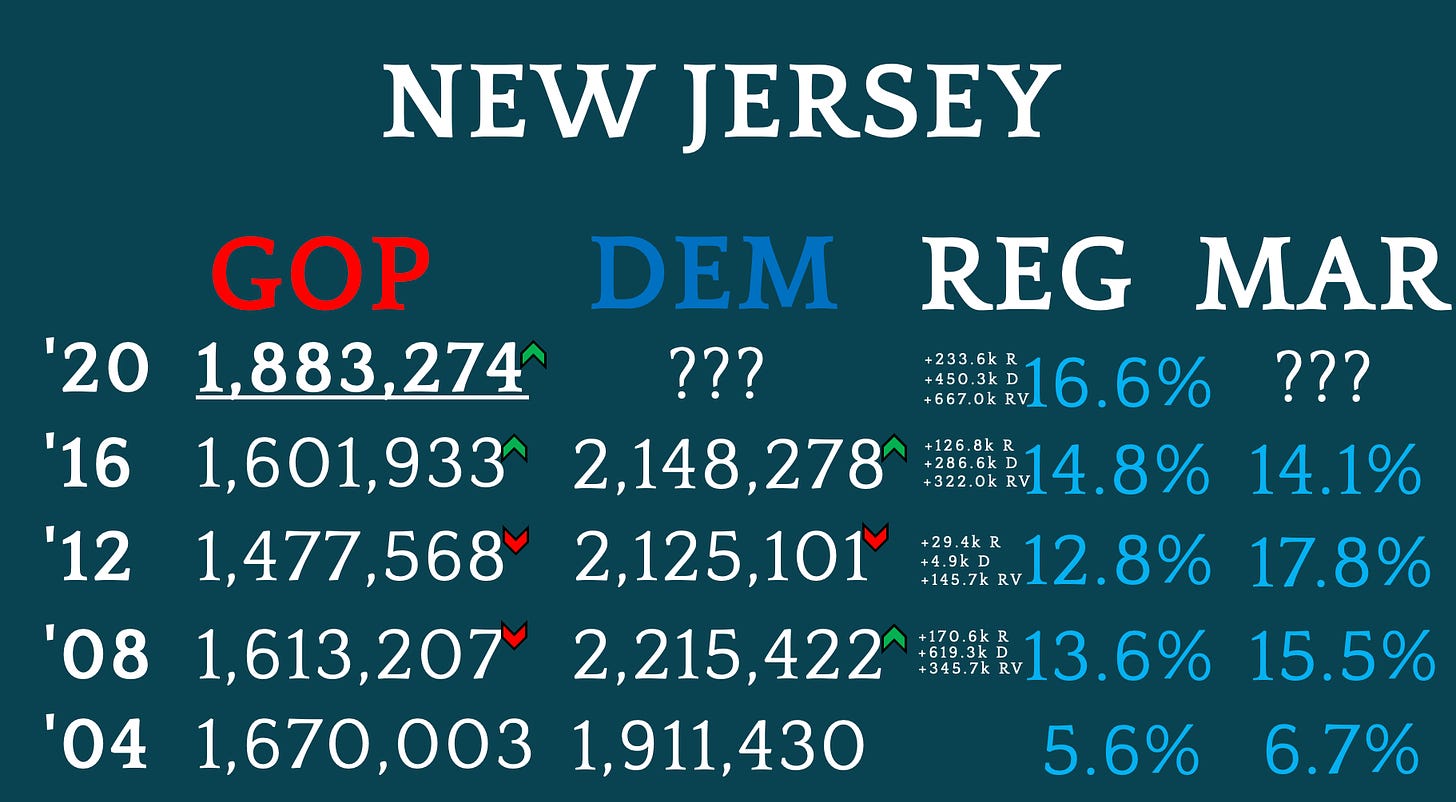
2004: Kerry wins by 6.7%, but Bush put a hard Republican shift on the margin from 2000 and even flirted with campaigning there.
2008: 45 of 50 states become more favorable to the Democrat nominee (Obama), who gains 303,992 votes over Kerry – a gain large enough to come at the expense of the McCain column, which lost votes from Bush. Obama wins by 15.5% - landslide territory. Voter registration surged eight points in favor of Democrats, foreshadowing the result.
2012: Because Mitt Romney was such a poor fit for the working class, New Jersey defies political gravity and is one of just seven states to move further left from 2008, going to Obama by 17.8%. This comes despite both candidates hemorrhaging votes from the previous election and despite the Republican Party picking up a little ground in voter registration Party ID.
2016: New Jersey begins a course correction to the right with Donald Trump as Republican nominee. Trump has a modest gain over Romney, which wasn’t hard to do, but is still short of McCain’s 2008 vote total. Clinton fails to get back to Obama’s 2008 total, and as a result, New Jersey comes in at 14.1% in margin for the Democrat nominee.
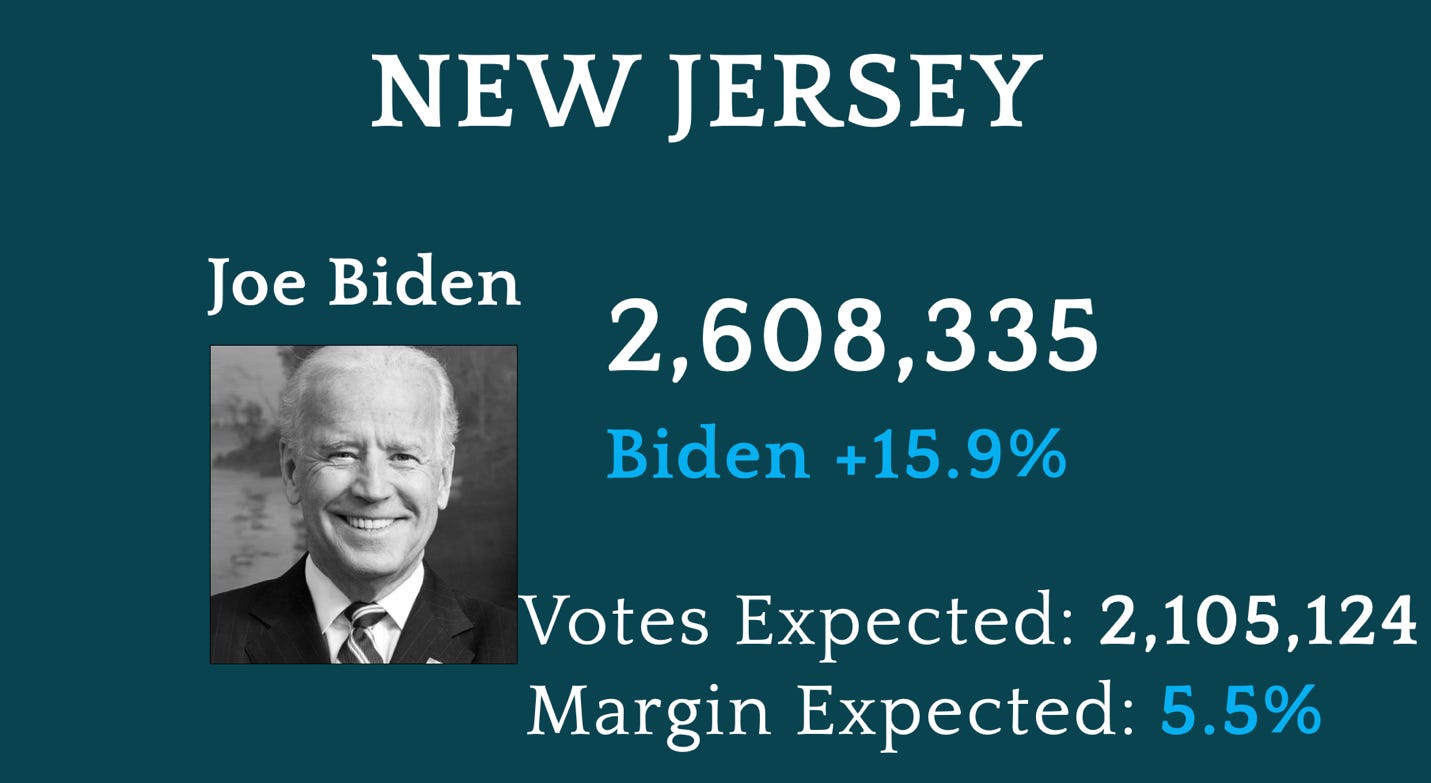
2020: Trump, already with a 3.7% move in his direction in New Jersey, seems poised to make the state competitive, especially after he posts a gain of 281,341 net new votes from 2016, the highest net increase in the state in two decades for a Republican and nearly equal to Obama’s leap from 2004 to 2008; however, New Jersey has begun tinkering with Automatic Voter Registration, 667,000+ net new voter registrations come on board (321,000+ higher than the 2008 Obama surge), and even though Biden appears destined to settle around the 2.1 million Democrat vote mark for the third cycle in a row (and escape with a 5.5% margin of victory in keeping with the state’s rightward drift), Biden comes in at:
2,608,335 votes.
A gain of 460,057 votes – making Obama’s 2008 surge look like a walk in the park. Despite Trump’s sizable gains, New Jersey creeps two points back to the left.
Certainly, if this result is legitimate and enough to relegate Obama’s 2008 performance to the dustbin, Biden must have put a beating on Trump in New Jersey’s Democrat-run urban centers that is one for the history books, right?
Keep reading with a 7-day free trial
Subscribe to Captain K's Corner to keep reading this post and get 7 days of free access to the full post archives.


